Why does a trader need a trading journal? It may seem like a simple question. Everyone knows: a trading journal is a tool that shows:
- How many trades were placed
- Their effectiveness
- What works well, what doesn’t
Article content
- 1 How to create a trading journal
- 2 Ready-made trading journal
- 3 Trade analyzer
- 4 Available charts
- 5 Trade analyzer recommendations
- 6 Online trading journal: Spreadsheets
- 7 What you are missing if you don’t keep track of your trades
- 8 How to create your own trading journal: a simple template
- 9 How to gather data and statistics
- 10 How to evaluate statistics
- 11 Summing up
However, not all traders keep a trading journal. So, this article has one purpose: to show that keeping a trading journal is worth your time, even though you can be reluctant at times to sit down and log all of your trades.
We will show what results traders get when they keep a journal. Let’s start with the basics.
How to create a trading journal
There are three ways to create a trading journal:
- Find a ready-made template, in Excel, for example
- Get an online trading journal software (paid or free)
- Make a journal yourself
Ready-made trading journal
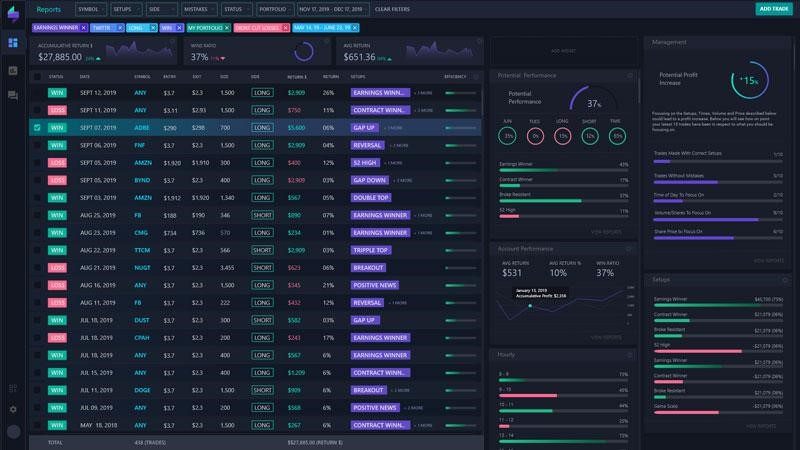
If you are too lazy to figure out how to deal with Excel and Google Spreadsheets, you can use a trading journal software:
- Edgewonk
- TraderSync
- Trademetria
These web-based software usually come with a monthly subscription and are regularly updated. They can be a great solution for the lazy. On the other hand, the functionality of a web-based trading journal can be easily implemented in spreadsheets.
Trade analyzer
To simplify a trading process and make it more convenient, AMarkets added a new tool – “Trade Analyzer”. The service analyzes the account profitability, balance, equity, maximum drawdown and maximum leverage and displays a chart that shows the changes of each of these indicators over time.
The analyzer allows you to track the current state of your account, showing the main account parameters, data on the current trading session and transactions history. The service also provides statistical indicators for your current trading: actual leverage, drawdown, daily profitability.
It is a great everyday assistant for both novice traders and professional FX market participants.
Available charts
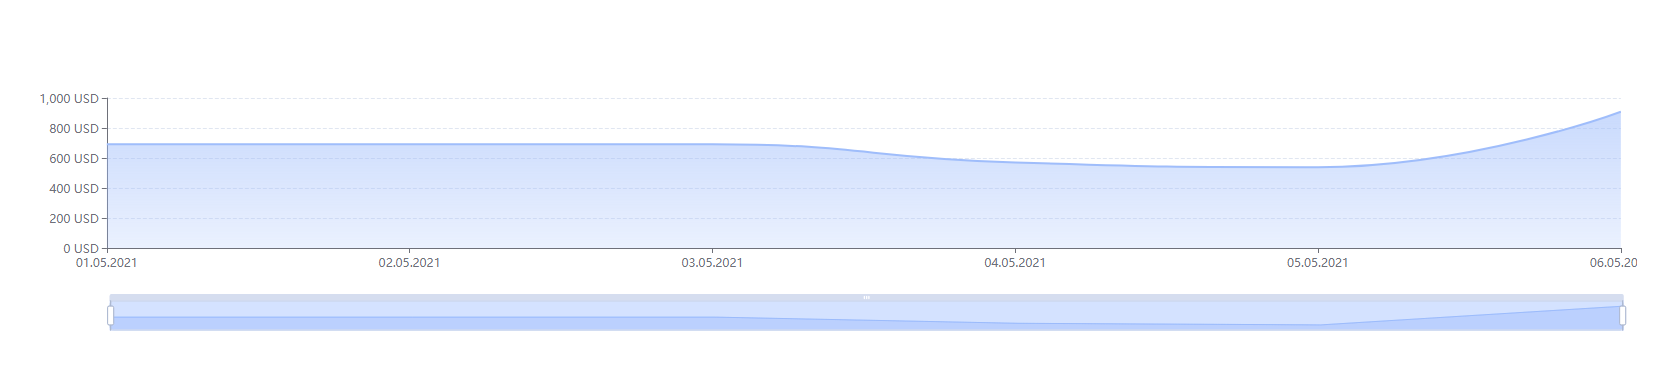 Trade analyzer charts
- Profitability – changes in the account profitability over a given period.
- Balance – changes in the account balance over a given period.
- Equity – changes in the account equity over a given period.
- Maximum drawdown % – changes in the maximum drawdown on the account over a given period.
- Maximum leverage – changes in the maximum actual leverage used on the account over a given period.
Charts are just a part of the trade analyzer’s functionality. The key advantage of this service is trading recommendations. Based on the account history, the service offers recommendations to improve your trading approach.
Trade analyzer recommendations
- Recommended leverage. This section evaluates the leverage used by the trader;
- Limiting potential losses. The service will alert you if you tend to perform transactions without placing stop-loss orders;
- Drawdown analysis. The service evaluates your account equity and gives recommendations on acceptable drawdown level;
- Recommendations on the optimal number of trading instruments. The service helps you choose the optimal number of assets;
- Recommendations on the risk-reward ratio. The analyzer estimates the average profit to the average loss ratio and gives recommendations for maintaining the optimal ratio.
The Trade analyzer is already available to each client in the Services section of a Trader Area. Feel free to test it right now!
Online trading journal: Spreadsheets
You can log your transactions in a regular paper journal. Many people do that.
But when you have more than 10 trades, you realize that you may need better organization.
This is exactly the case when an online journal or spreadsheets can come in handy.
To get started, you can get a template on the Internet and adjust it for yourself. And, believe it or not, it’s not as complicated as it may seem.
What you are missing if you don’t keep track of your trades
You won’t know anything about your trading
All you can see is whether you are making money or not. It’s enough to take a look at your trading account balance to see if the numbers are growing or not.
It’s good if the money in your account grows. And if not? You need to figure out why.
A trading journal allows you to review your trading history to find out what went wrong. And, there may be dozens of reasons why it didn’t work out:
- Which strategy failed and why?
- What’s the best trade of the week? Which is the worst?
And a bunch of other questions we ask to find out what goes wrong. At the same time, we optimize our trading process.
You won’t know how long your trade lasts
Without the journal, you won’t know how long your transaction lasts. You can hope to close 3 profitable trades in a week. And statistics show that our trade lasts 10-13 days on average.
You won’t know the strengths and weaknesses of every trade
- Why was the trade successful? Maybe, you just got lucky?Which trend was it?
- Which candlestick pattern worked out, and why?
- As traders, we have to ask these questions. And we can find all the answers in our log.
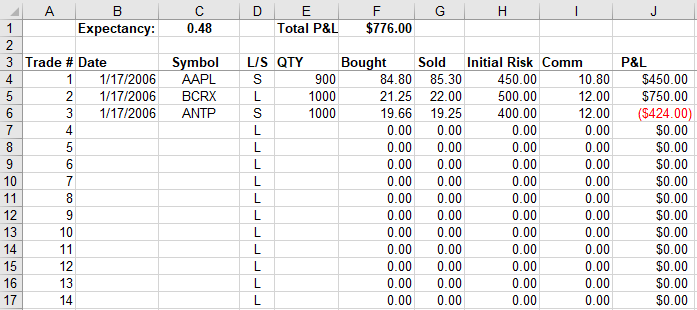
How to create your own trading journal: a simple template
As we become more experienced, we can always adjust and improve our trading journal. And in the beginning, you can use a simple template:
First, create a basic, six-column spreadsheet:
- Trade’s number
- Asset
- Date
- Strategy
- Result
- Comment
Every time you add a new item, ask yourself:
“Which statistics will it help me gather? Will it overload my trading journal?”
You will be making records in your journal every day, so it’s important not to overload it with unnecessary information.
How to gather data and statistics
The more data we enter, the more information we can extract.
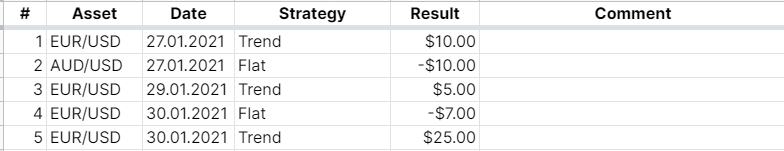
Let’s go back to our six columns. Suppose we closed 5 trades and now we want to evaluate their effectiveness:
Advice. Use Google Sheets: it allows you to use functions and formulas to automate calculations.
Select the data in the Assets column. Click the “Explore” button in the lower right corner (or press ctrl + shift + x) to see the statistics for selected cells:
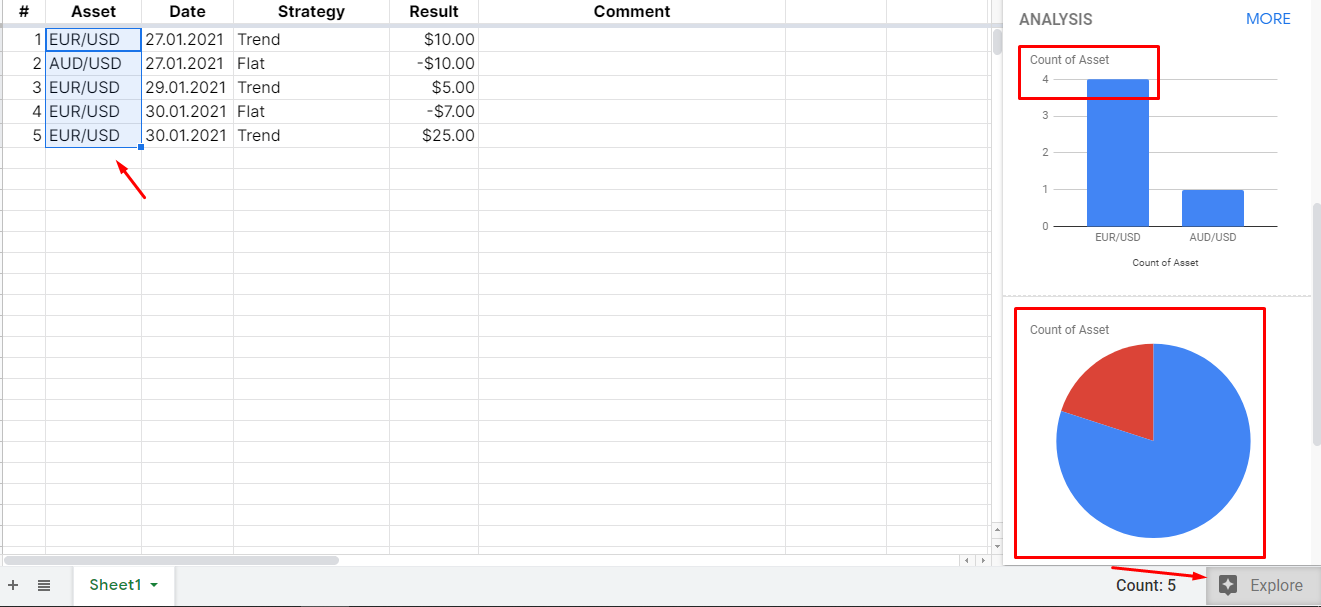
We can see that in 80% of cases, we trade EUR/USD, and only one trade out of 5 (20%) was placed in AUD/USD.
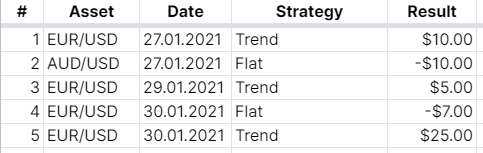
Now let’s select the data from the “Strategy” column:
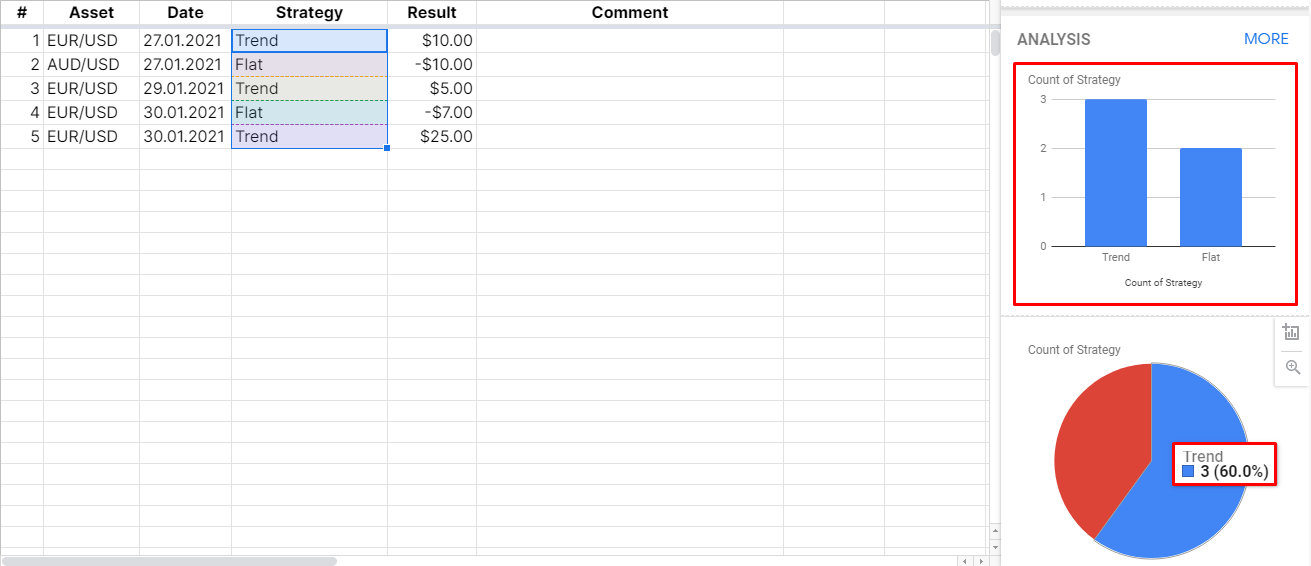
Our statistics show: we performed 60% of all trades in a strong trend, 40% were placed during a flat. No trades were placed against the trend. Well done!
How to evaluate statistics
We now have some general information about our trading style:
- We trade EUR/USD 80% of the time. Sometimes we also trade AUD/USD (20%).
- In 60% of cases, we trade with the trend, in 40% – in a sideways trend. We don’t trade against the trend, which is very good.
Now let’s evaluate the result. To do this, select two columns: Assets and Result.
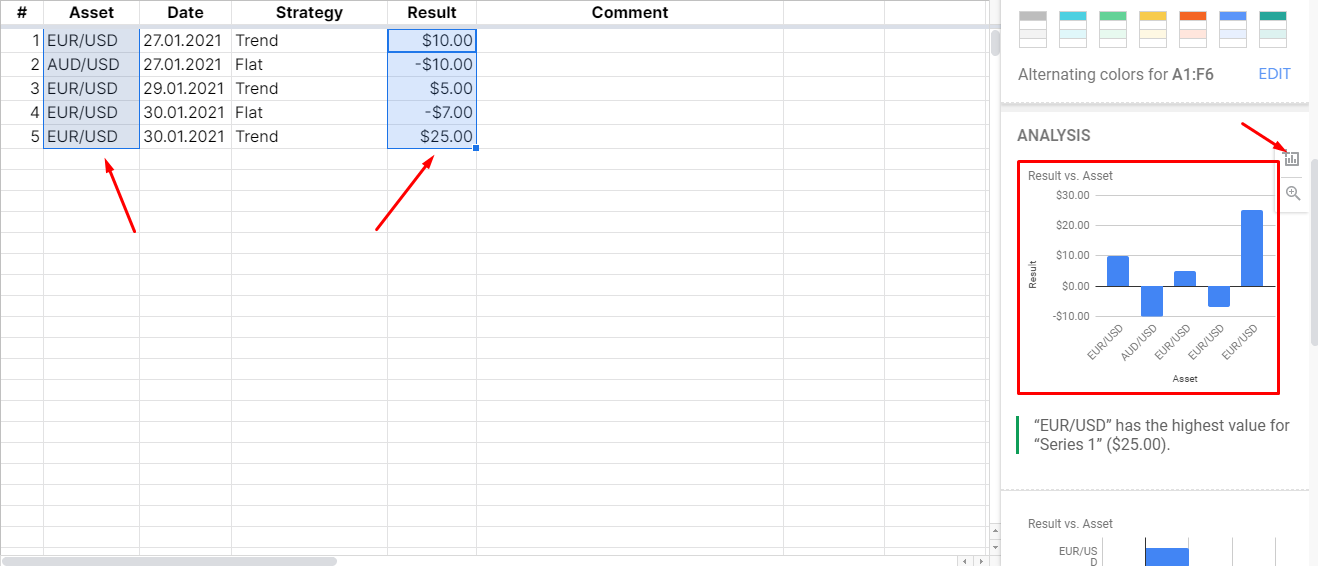
According to our trading log:
- We only had 2 losing trades: one in EUR/USD and one in AUD/USD
- We made 3 profitable trades in EUR/USD. We can see that the last trade was the most profitable and it covered all previous losses.
Now, the most interesting part – our trading result in numbers:
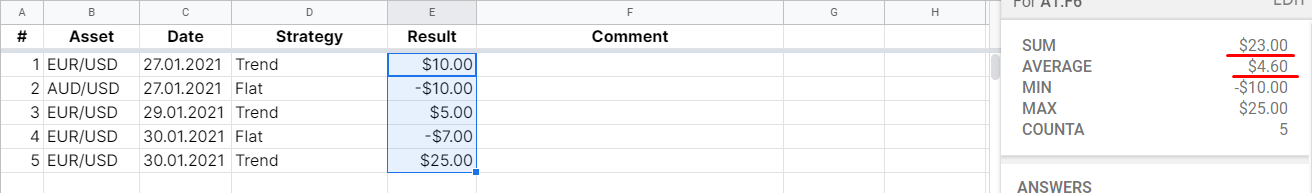
We earned a total of $23.00. Our average profit per trade is $4.60, and our maximum risk is $10.00.
And while it’s nice to know that our account balance has grown, there is a clear flaw in our trading: the maximum risk should not exceed the average profit.
If we risk too much, we risk losing some of our capital. We trade to earn money, not lose it, right?
Summing up
We hope that this article has made it clear why you shouldn’t start trading without a trading journal. We also recommend that you make at least 10-20 trades on a demo account before opening a live account.
Did you like this article? We regularly update our blog with new materials. We also recommend following us on Instagram and Facebook, where we post news about our current bonuses, promotions and market analytics.
If you like our articles, follow us on Facebook and Instagram. Stay tuned for more interesting posts on our blog. We post new material several times a week.