
Candlestick trading has been around for decades, but it’s far from old news. Originally introduced by Steve Nison, these patterns still play a central role in how traders read the market. The key isn’t just recognizing them — it’s understanding what they’re really telling you. Let’s break down six essential principles every trader should know.
Article content
- 1 What Are Candlestick Patterns and Why They Work
- 2 Key Principle #1: Trend Change vs Reversal
- 3 Key Principle #2: Trade With the Trend
- 4 Key Principle #3: Exit Signals and Risk Management
- 5 Key Principle #4: Why Context Matters in Candlestick Trading
- 6 Key Principle #5: How to Read Momentum from Candles
- 7 Key Principle #6: Combining Candlesticks with Indicators
- 8 How to Trade Candlestick Patterns (Step-by-Step Strategy)
- 9 Common Mistakes Traders Make
- 10 FAQ
What Are Candlestick Patterns and Why They Work
Candlestick patterns are a core part of price action trading, allowing market participants to interpret market psychology through visual price movements. Each candle reflects the battle between buyers and sellers, making candlestick signals a direct representation of sentiment.
Understanding how to trade candlestick patterns means recognizing that candles don’t predict the future; they reveal shifts in behavior. This is why a solid strategy focuses on context, trend, and confirmation rather than isolated patterns.
Key Principle #1: Trend Change vs Reversal
One of the most misunderstood concepts in trading is reversals. Markets rarely change direction instantly. What traders usually see instead is a gradual shift, where a trend slowly weakens and reverses.
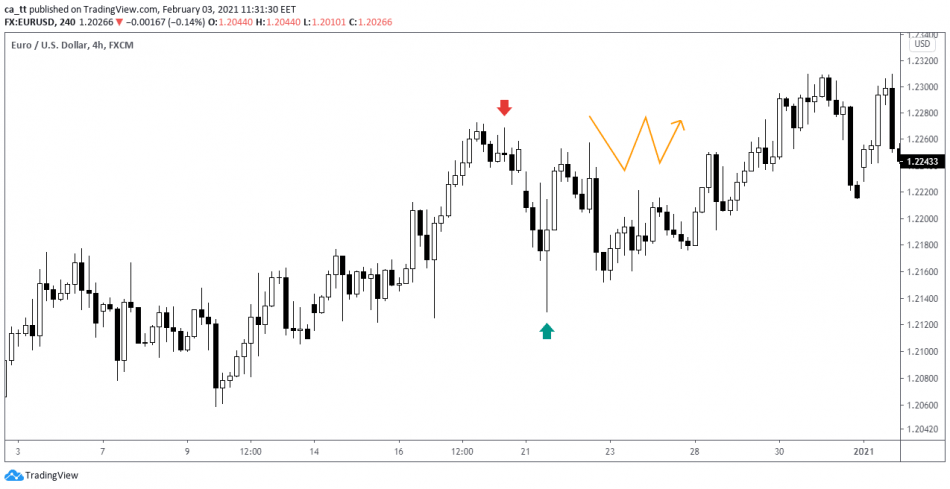
There are 2 reversal signals on the chart: a shooting star (red arrow) and a hammer (green arrow).
Both signals can be interpreted as reversal signals. In fact, these candles always indicate just one thing: a change in the mood of market participants.
In the chart above, the price starts moving sideways right after these reversal candlestick patterns appear. As we can see, the trend hasn’t reversed; it’s now sideways.
Understanding this distinction is critical for building a reliable candlestick trading strategy.
Key Principle #2: Trade With the Trend
A fundamental rule in price action trading is simple: never fight the trend.
Even strong candlestick signals lose reliability when traded against the dominant direction. For example, a bearish pattern in an uptrend is often just a temporary pause rather than a true reversal.
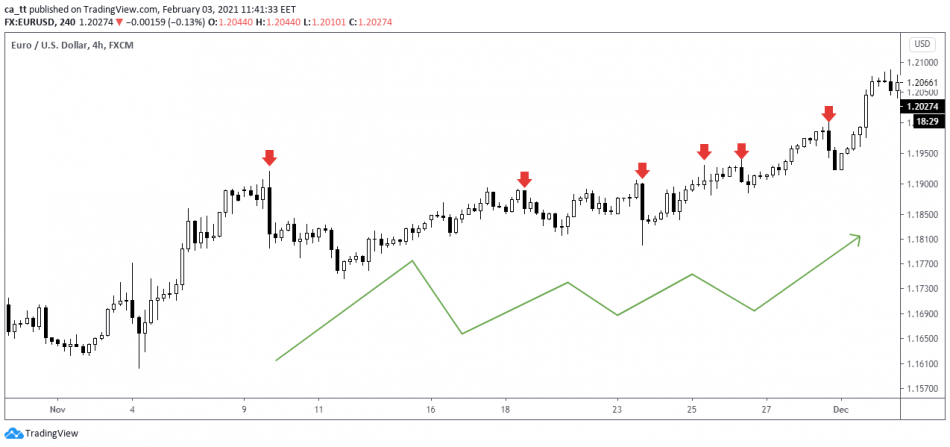
As you can see from this chart, just one trend trade can make you a fortune, while four trades against the trend can wipe out your account completely.
The trend persists because trading psychology doesn’t change over time. When most traders are buying, why go short? On the contrary, you need to wait for someone to “stumble” and make the wrong decision … and enter the market against their position.
Successful traders align their trades with the broader trend and use patterns as timing tools.
Key Principle #3: Exit Signals and Risk Management
Candlesticks are not only useful for entries but also critical for exits. In a well-structured strategy, traders monitor candlestick signals that contradict their position. If a strong opposing pattern appears, it’s often a sign to exit early.
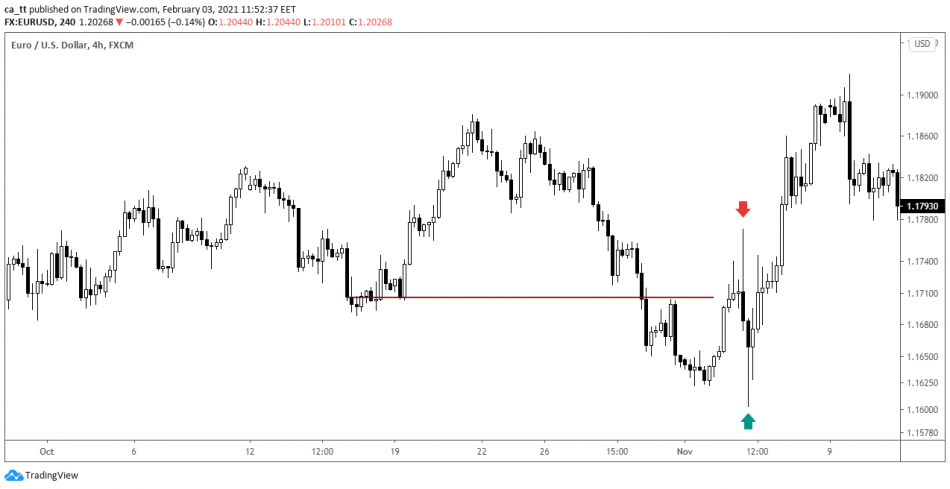
In the screenshot, we have a trending market and an entry from the swing zone. But as soon as we opened our position, a powerful reversal signal appeared, indicating a trend change. So, in this case, it’s best to exit the trade.
This approach improves risk control and aligns with advanced candlestick trading tips, where protecting capital is more important than maximizing every move.
Key Principle #4: Why Context Matters in Candlestick Trading
Context defines whether a pattern is meaningful or irrelevant. For example, analyzing bullish or bearish candlestick formations without considering trend direction leads to poor decisions. A hammer only works as a reversal signal if it appears after a decline.
This is why the support and resistance candlestick strategies are so powerful. When patterns form near key levels, their reliability increases significantly. In price action trading, context always outweighs the pattern itself.
Key Principle #5: How to Read Momentum from Candles
Momentum is visible directly in the candle structure. The size of the body, the length of shadows, and their proportions all indicate strength. Strong momentum candles have large bodies and minimal wicks, while indecision appears as small bodies with long shadows.
Understanding these nuances helps traders differentiate between weak and strong candlestick signals. This is especially important when comparing multiple setups and refining a strategy.
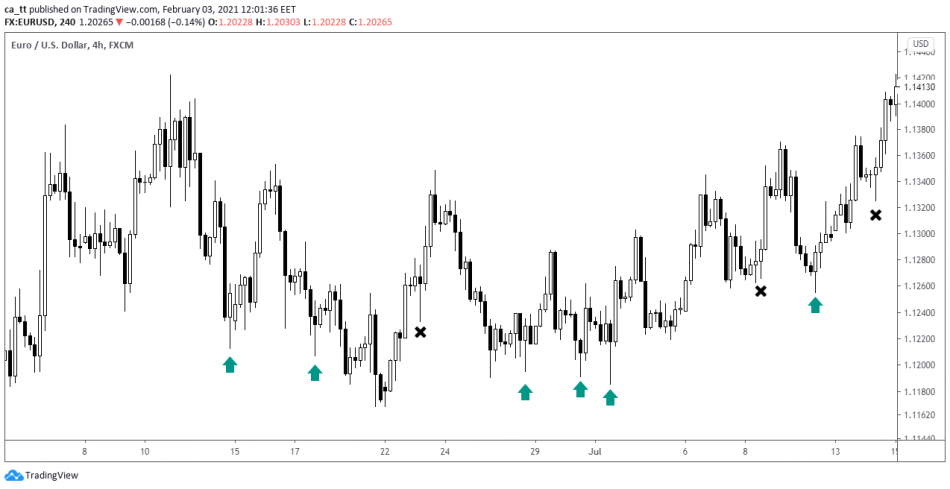
Let’s take 3 candlesticks, for example:
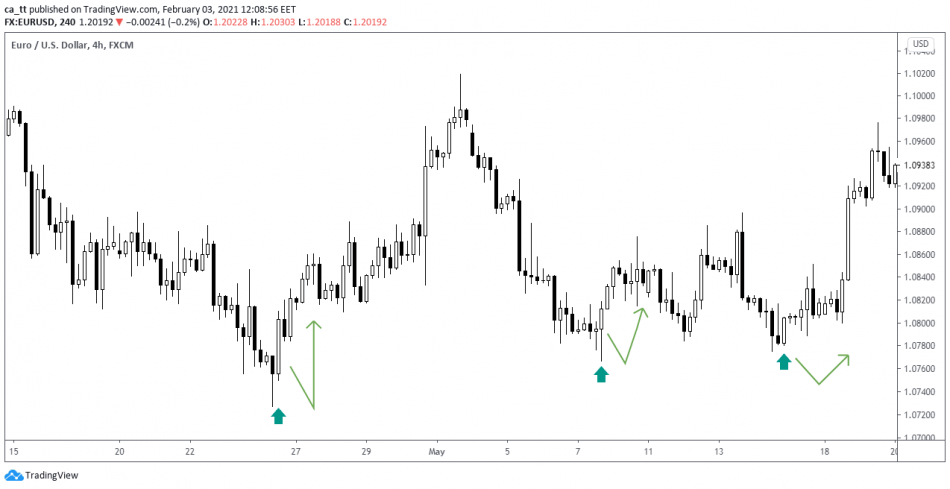
All formed at the bottom of the market, but they all have different characteristics:
- The first combination of two candles shows a sharp market reversal at the bottom. Candlesticks emerged after a strong downtrend.
- The second setup is also powerful, but it is not preceded by such a strong decline.
- The third setup is the weakest and emerged during a sideways trend.
Key Principle #6: Combining Candlesticks with Indicators
Candlestick patterns become significantly more powerful when combined with other tools. Using candlestick confirmation signals such as trendlines, moving averages, or support and resistance zones increases the probability. The best setups often occur when multiple signals align, a principle that experienced traders rely on consistently.
How to Trade Candlestick Patterns (Step-by-Step Strategy)
Entry Rules
- Identify the overall trend.
- Wait for clear candlestick signals in the direction of the trend.
- Confirm the setup using support/resistance or indicators.
- Enter after the candle closes to avoid false signals.
Stop Loss Placement
Place stop loss beyond the structure of the pattern:
- Below the low of a bullish setup
- Above the high of a bearish setup
This approach helps filter out market noise, but it is equally important to keep the risk-to-reward ratio in mind.
Take Profit Strategy
Use logical price levels:
- Previous highs/lows
- Key support/resistance zones
- Risk-to-reward ratios (e.g., 1:2 or higher)
Combining these with price action trading methods improves consistency.

Common Mistakes Traders Make
- Trading patterns without context
- Ignoring the main trend
- Entering before the candle closes
- Over-relying on a single signal
- Misinterpreting bullish and bearish candlestick setups
Avoiding these mistakes is essential for developing a profitable candlestick trading strategy.
FAQ
What is the best candlestick trading strategy?
The best approach combines candlestick patterns trading with trend analysis and confirmation tools. No single pattern works in isolation.
How to trade candlestick patterns effectively?
Focus on trend direction, wait for confirmation, and use proper risk management.
Are candlestick signals reliable?
Yes, but only when used in context. Combining them with confirmation signals improves accuracy.
What is the difference between reversal and continuation?
A reversal signals a potential shift, while continuation suggests the trend will persist.
Do professionals use candlestick patterns?
Yes, especially in price action strategies, where candles are a primary decision-making tool.