
The Commodity Channel Index (CCI) is a widely used technical analysis tool that helps traders identify momentum and price deviations from the average. Despite its name, the indicator is not limited to commodities; it works effectively across Forex, stocks, and cryptocurrency markets.
Traders rely on the Commodity Channel Index because it highlights when an asset may be overbought or oversold, offering valuable insights into potential reversals and trend strength. As one of the most practical momentum indicators in trading, it can significantly improve decision-making when applied correctly.
Article content
- 1 What Is the CCI Indicator and How Does It Work
- 2 CCI Formula and Core Concept
- 3 Understanding the CCI Range
- 4 How to Read CCI Signals
- 5 How to Configure the CCI Indicator
- 6 Best CCI Trading Strategies
- 7 Advantages and Limitations of CCI
- 8 Common Mistakes When Using CCI
- 9 Risk Management When Trading with CCI
- 10 Conclusion
What Is the CCI Indicator and How Does It Work
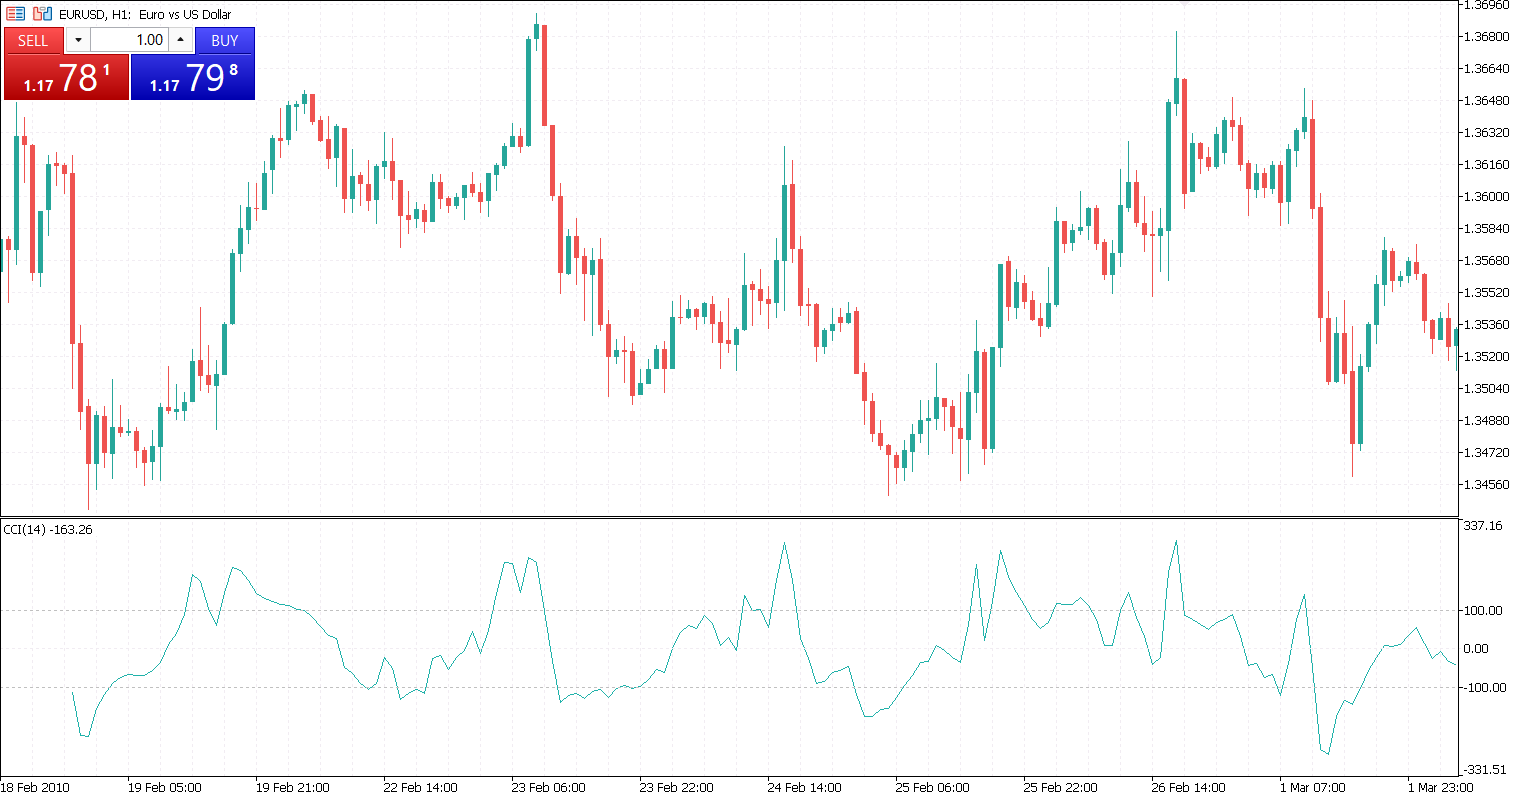
The CCI is an oscillator that measures the extent to which an asset’s price deviates from its average over a defined period. Simply put, it gauges the momentum of price movements in relation to their typical range.
CCI Formula and Core Concept
At its core, the CCI trading indicator measures how far the price deviates from its statistical average.
- It compares the typical price (high + low + close) / 3 to a moving average
- Calculates deviation from that average
- Displays the result as an oscillator
Understanding the CCI Range
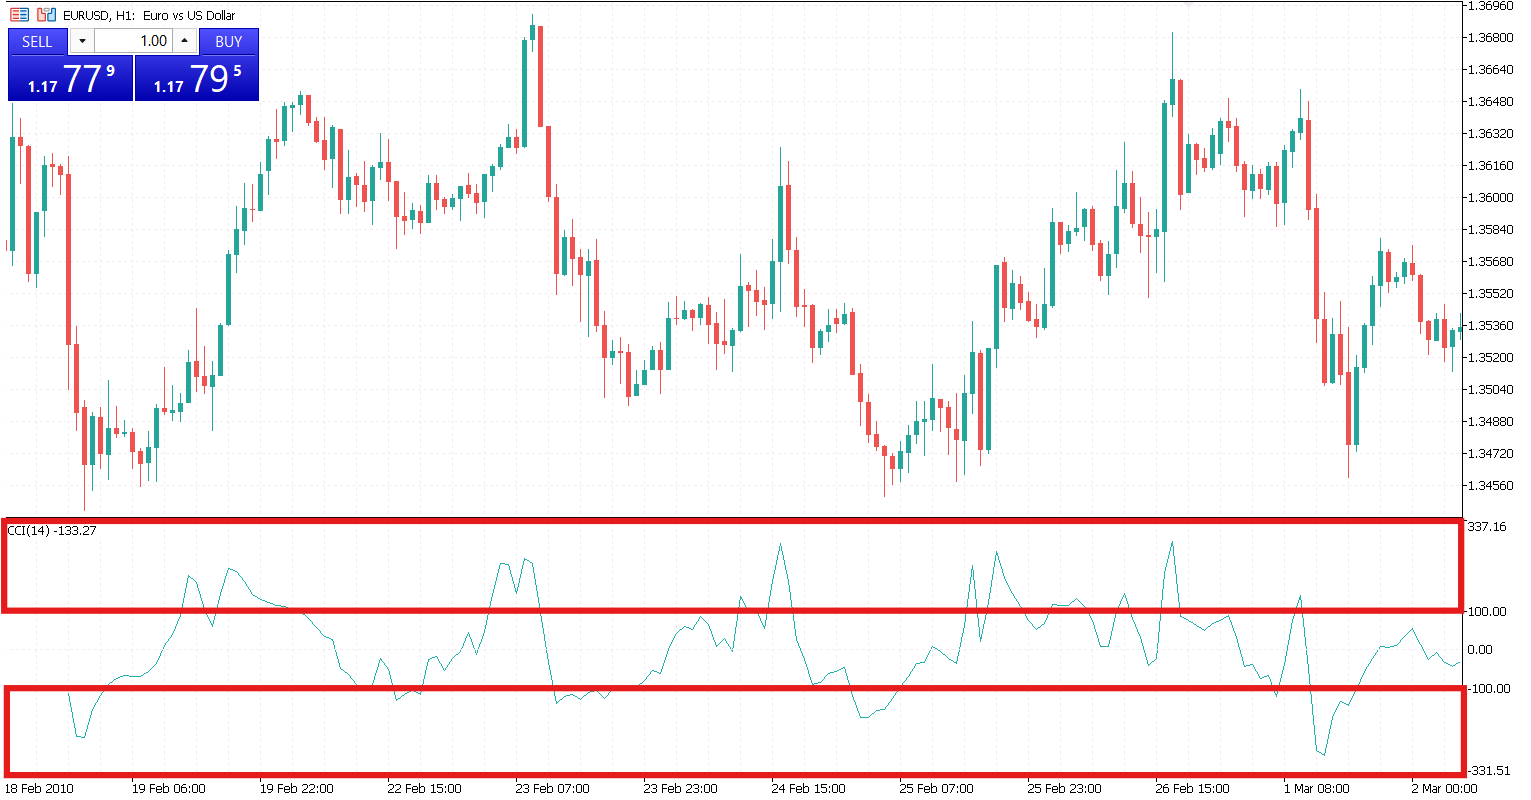
The CCI indicator in trading typically ranges from -100 to +100. When the value rises above +100, it suggests that the asset may be overbought. When it falls below -100, it indicates that the asset may be oversold. These levels can help traders identify potential market turning points, but they shouldn’t be used as the only signal for making trading decisions.
How to Read CCI Signals
Overbought and Oversold Signals
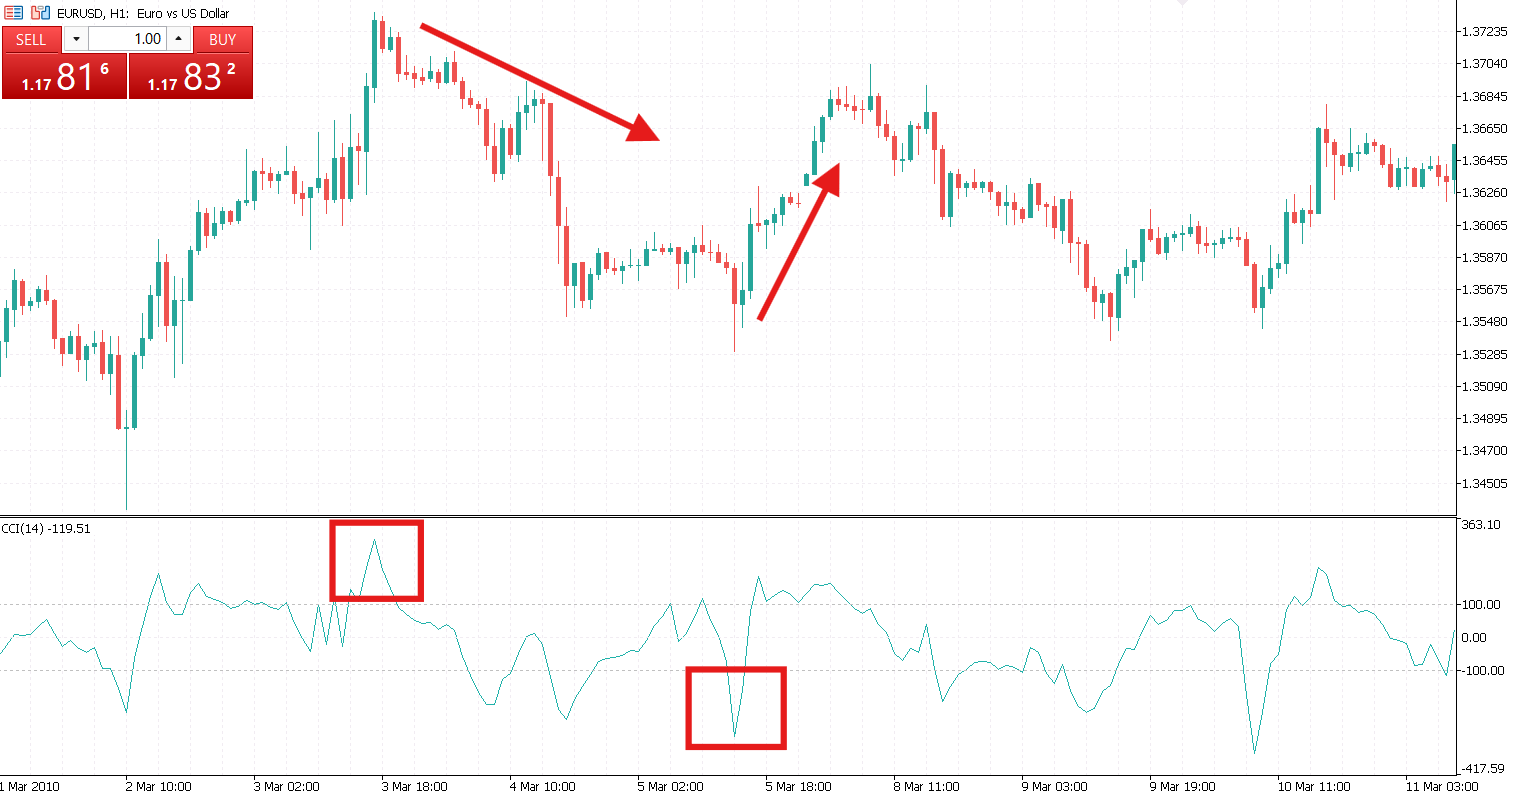
Understanding CCI buy and sell signals is essential. A move above +100 indicates overbought conditions and may suggest a potential selling opportunity, while a drop below -100 indicates oversold conditions and may suggest a potential buying opportunity, as these levels reflect extreme market situations where reversals can occur.
Trend Identification Using CCI
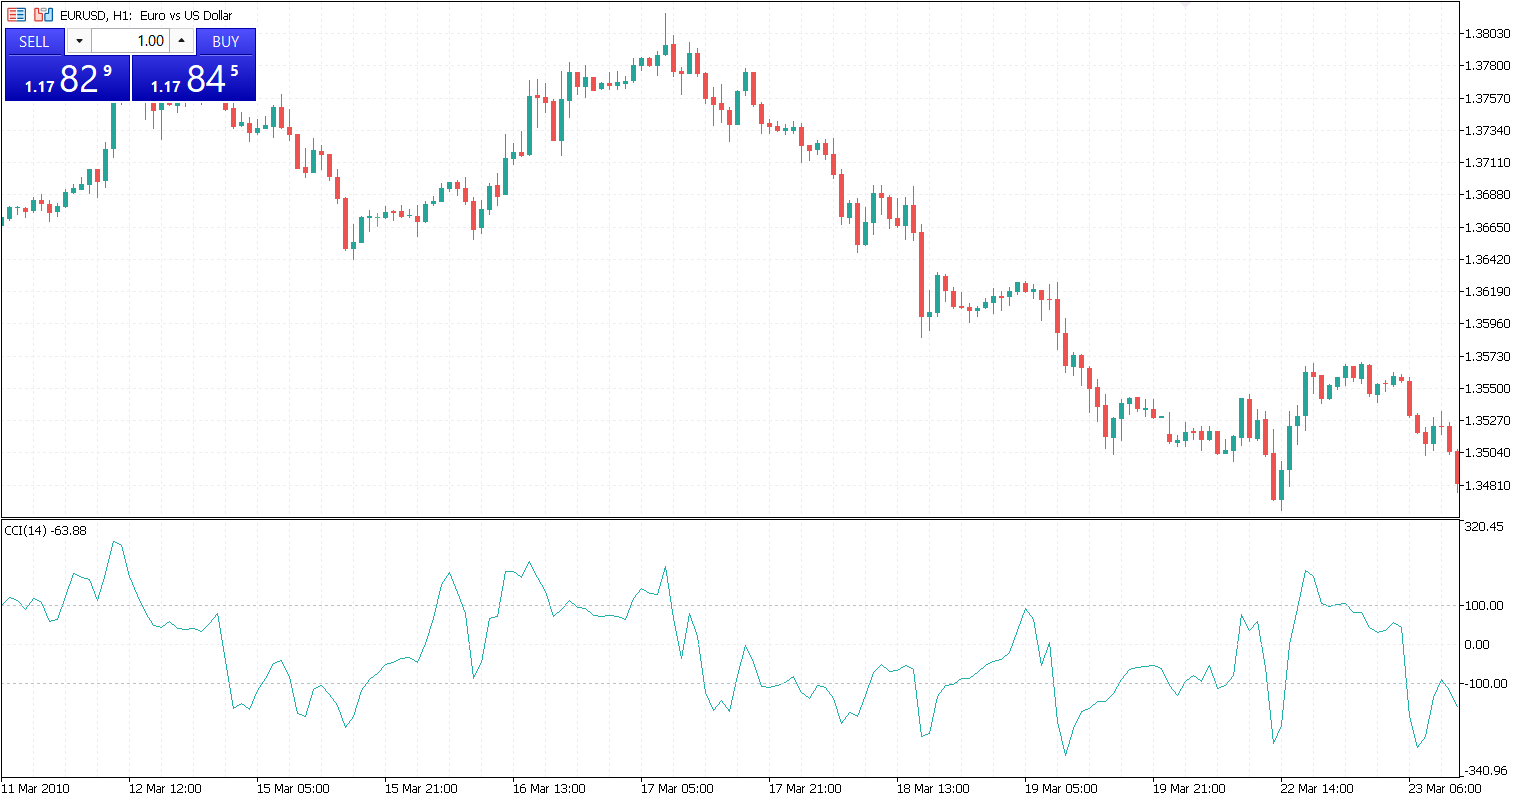
The zero line is another important element. A value above 0 signals bullish momentum, while a value below 0 indicates bearish momentum. Strong trends can keep the indicator in extreme zones for extended periods, a key factor in developing a CCI trading strategy.
Divergence Signals
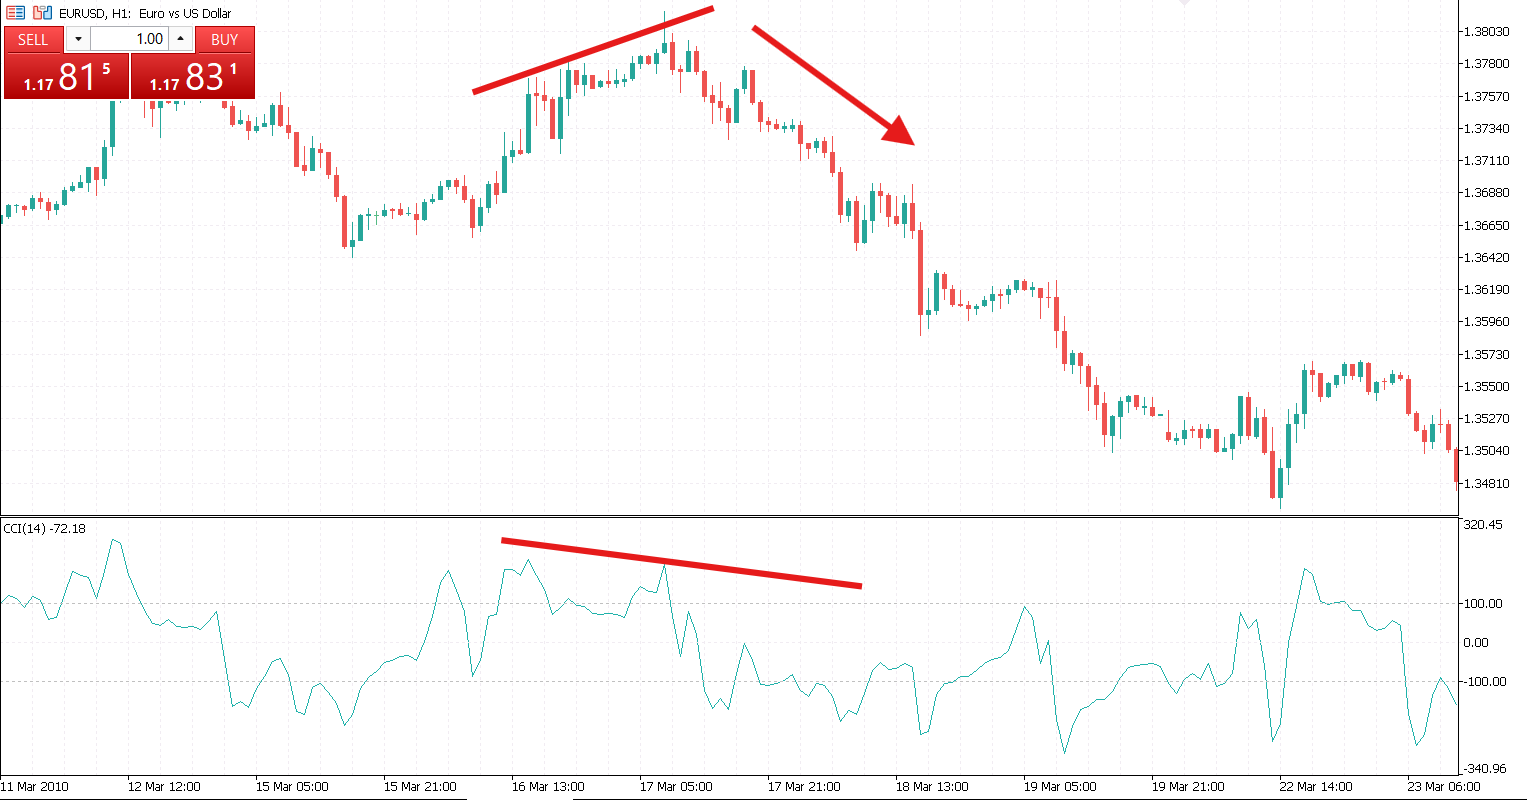
CCI divergence trading is one of the most powerful techniques. When price makes higher highs, but the indicator does not, it signals a weakening uptrend. When price makes lower lows, but CCI rises, it indicates a weakening downtrend. Divergence often points to early trend reversals.
The CCI can be used on its own, but it becomes significantly more effective when combined with other indicators.
How to Configure the CCI Indicator
Best CCI Settings (Period Length)
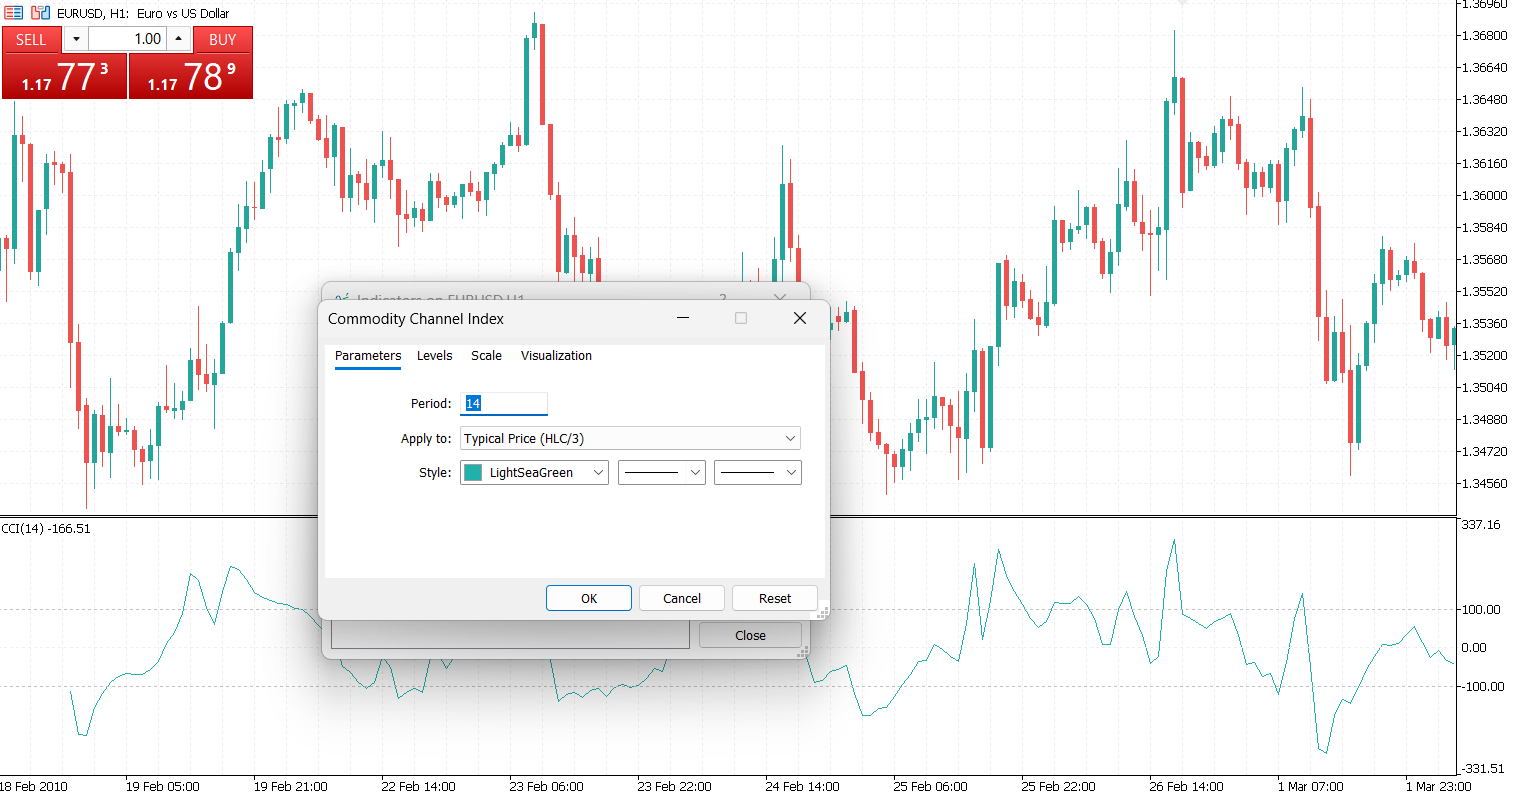
Choosing the right CCI indicator settings is crucial. Default values are usually 14 or 20 periods. A shorter one gives more signals but also more noise. A longer period makes the indicator smoother and produces fewer signals. The best CCI strategy depends heavily on aligning settings with your trading style.
How to Choose the Right Settings
To optimize the CCI indicator, adjust it to market volatility, align it with the asset’s cycle, and backtest different settings. This helps ensure the strategy is tailored rather than generic.
Best CCI Trading Strategies
Strategy 1: CCI + Moving Average
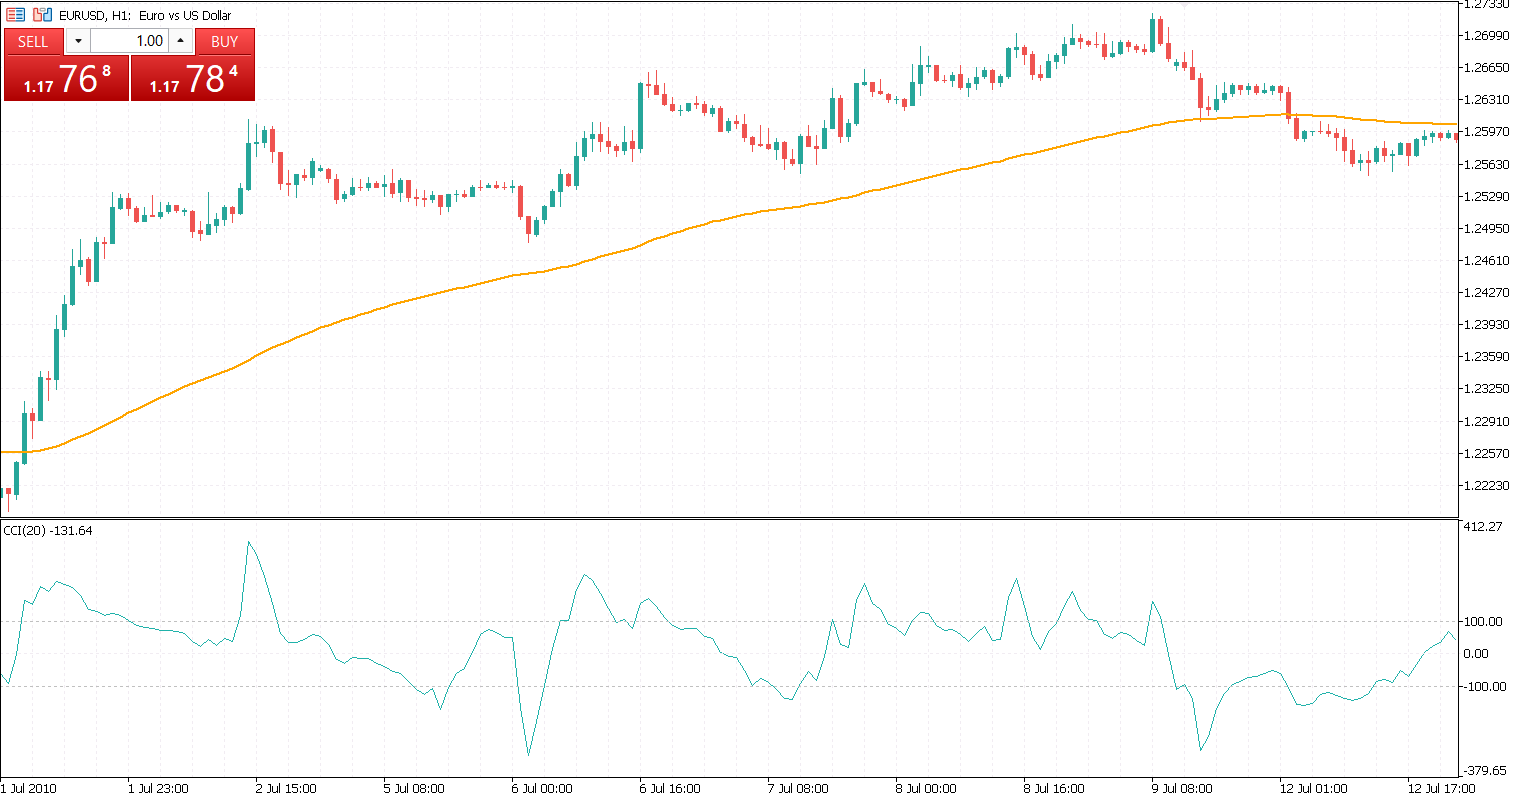

This CCI moving average strategy is designed for trend-following systems. It uses a 20-period CCI and a 100-period moving average. Buy when the price is above the moving average, and the indicator line exits oversold conditions. Sell when the price is below the moving average, and CCI crosses below +100. The strategy works best on lower timeframes, such as 5-minute to 15-minute charts.
Strategy 2: CCI + MACD + Parabolic SAR
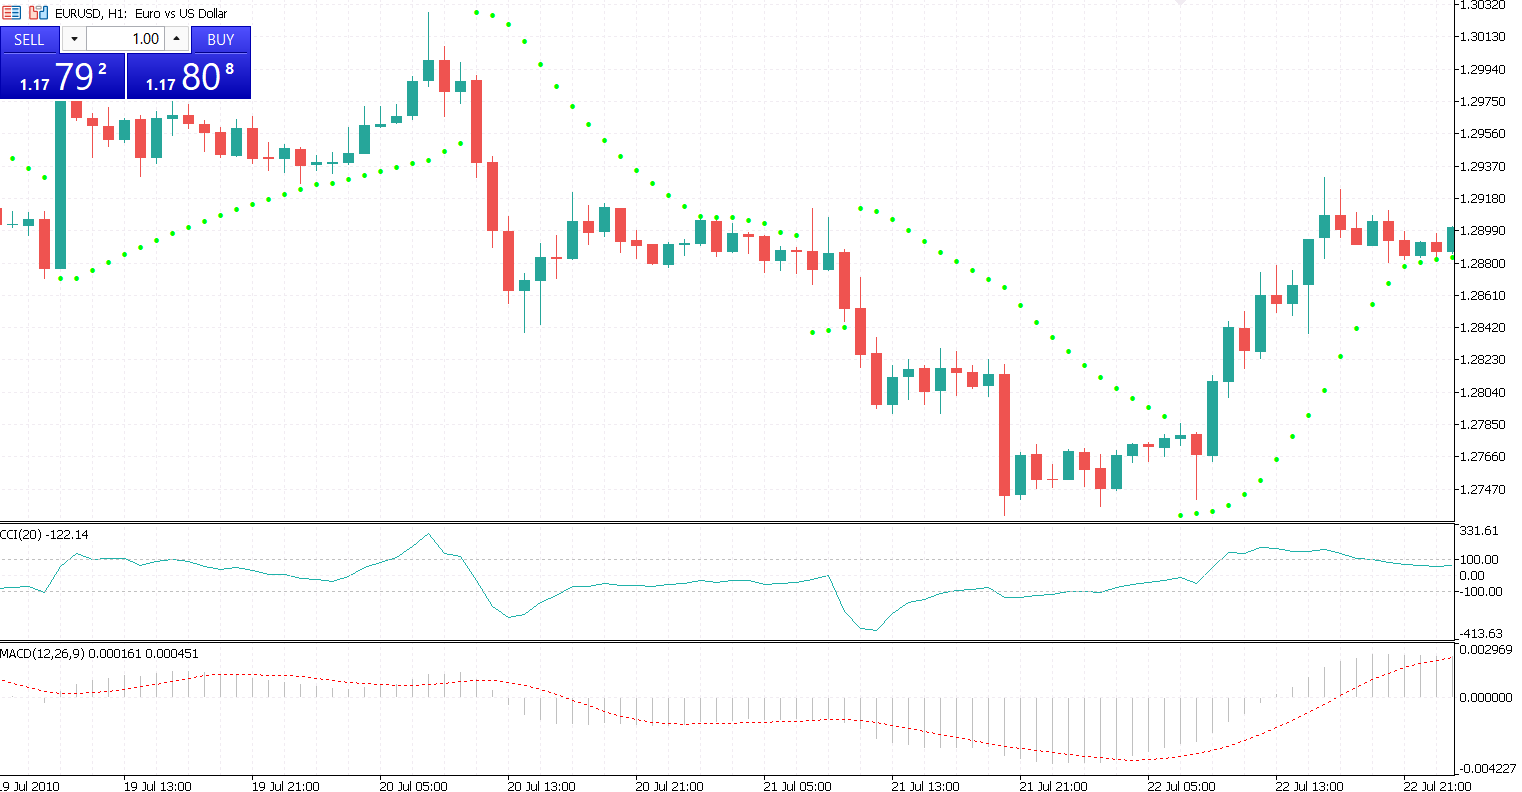
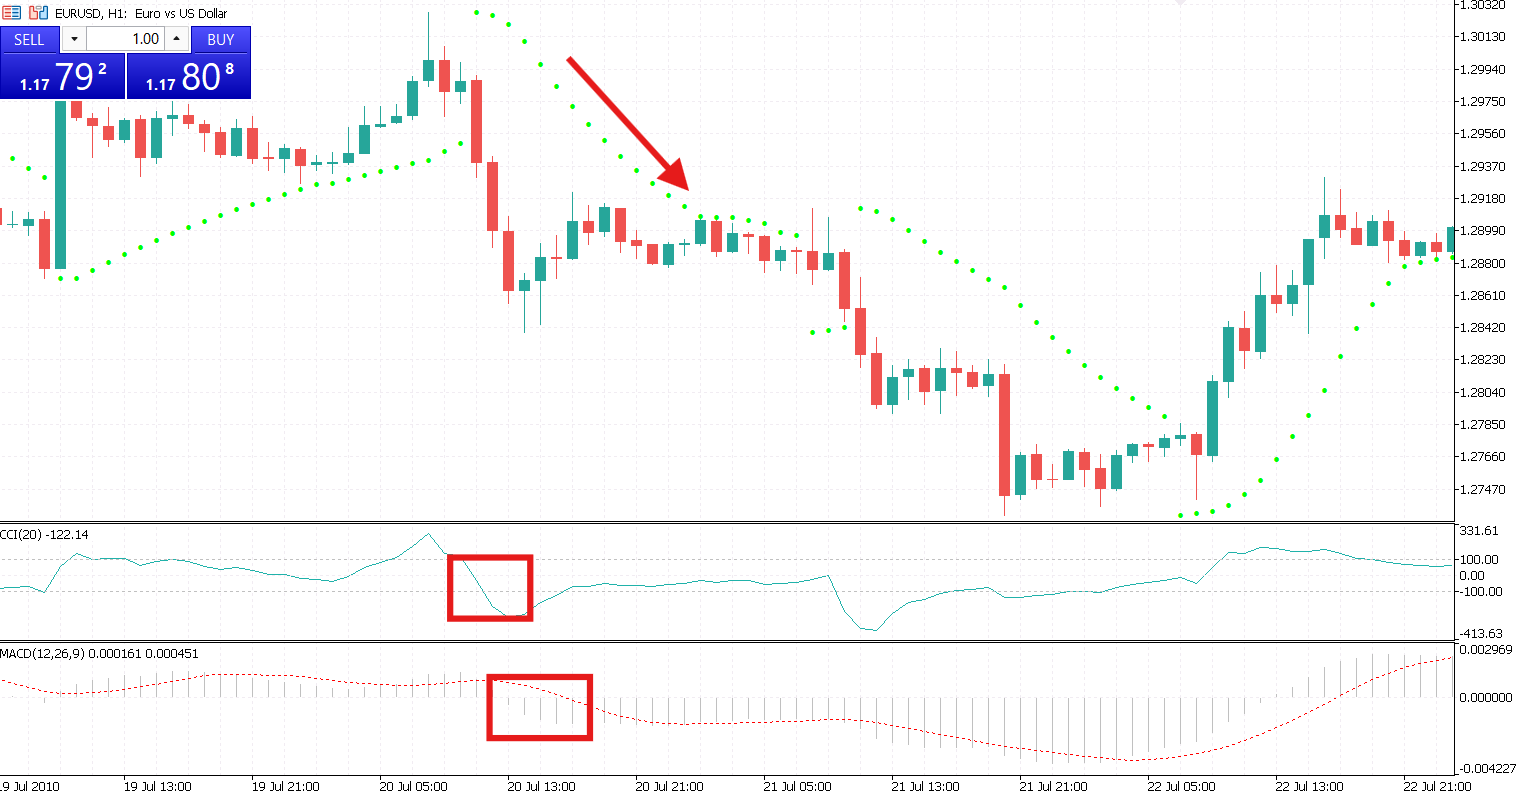
A powerful multi-indicator system combines key technical tools for trading. It uses CCI for momentum, MACD for trend direction, and Parabolic SAR for entry timing. A sell setup occurs when the Commodity Channel Index drops below +100, MACD shows a bearish crossover, and Parabolic SAR dots move above the price. This approach shows that CCI vs MACD is not a competition, as they are most effective when used together rather than separately.
Strategy 3: CCI Divergence Strategy
Focused on reversals, this strategy starts by identifying divergence between price and CCI. It then confirms the setup using price action around key support and resistance levels before entering a reversal confirmation. This is considered one of the most effective advanced CCI trading strategy methods.
Advantages and Limitations of CCI
Pros of the CCI Indicator
- Ease of interpretation
- Applicability across all markets
- Effective momentum detection
Cons of the CCI Indicator
- False signals in sideways markets
- Lagging nature
- Need for confirmation from other tools

Common Mistakes When Using CCI
Using CCI as a Standalone Indicator
Relying only on the Commodity Channel Index reduces accuracy. Always combine it with other technical indicators for trading.
Ignoring Market Context
Market structure matters, including trend direction, volatility, and key levels. Ignoring these factors can lead to poor trading results.
Overtrading Based on Signals
Too many signals, especially on low timeframes, can cause overtrading and losses.

Risk Management When Trading with CCI
Using Stop-Loss and Take-Profit
Always protect your funds with a stop-loss to limit losses and a take-profit to lock in gains.
Combining with Other Indicators
Improve accuracy by pairing moving averages, MACD, and price action to strengthen your CCI indicator trading approach.
Backtesting and Demo Trading
Before going live, test your strategies on historical data, use demo accounts, and refine your system.
Conclusion
The Commodity Channel Index is a versatile and powerful tool for analyzing momentum and identifying potential reversals. While it provides clear signals, its real strength lies in its confirmation and in combining it with other indicators.
Understanding how to use the indicator effectively helps traders detect overbought and oversold conditions, spot divergence and trend weakness, and improve entry and exit timing. When used correctly, the indicator becomes an important part of a consistent and disciplined trading strategy.