
Trading is the art of buying and selling assets such as stocks, currencies, commodities, or cryptocurrencies to make a profit. Financial markets serve as platforms for exchanging these assets. This guide will help you master the trading theory and develop the necessary skills. Ready to get started? Let’s dive in!
Article content
Part I
Why Choose Trading?
Motivations driving novice traders can be diverse:
- Financial Independence. Trading is a powerful means to create a stable source of income that provides financial independence.
- Freedom. Trading allows you to work from anywhere in the world and maintain a flexible schedule.
- Skill Development. Trading helps broaden your horizons by studying financial markets, analyzing data, and developing strategies.
- Challenge. For some, trading becomes a fascinating hobby that provides an opportunity to test oneself.
Regardless of your motivation, we will strive to assist you in making your entry into trading as successful as possible, providing full informational support and high-quality customer service.

What Are Stocks, Forex, Cryptocurrencies, and Other Markets?
- Stocks. Stocks represent ownership shares in a company. When you acquire stocks, you effectively become a co-owner of a portion of that company. The stock market is considered one of the most popular among investors.
- Forex (Foreign Exchange). Forex is the currency exchange market where traders buy one currency and sell another, hoping for changes in exchange rates. Forex is the largest and most liquid financial market globally.
- Cryptocurrencies. Cryptocurrencies such as Bitcoin, Ethereum, and others are digital assets that utilize blockchain technology. The cryptocurrency market has become one of the most dynamically evolving and highly volatile markets.
- Commodities. The commodities market includes assets like oil, gold, sugar, and other raw materials. Traders profit from price fluctuations in these commodities.
- Indices. Indices reflect the overall market’s condition. For instance, the S&P 500 index encompasses stocks from the 500 largest US companies. Trading indices allows traders to access various market segments.
- Bonds. Bonds are debt securities issued by companies or governments to raise capital.
Broker, CFD, and Trading Platform
Broker. A broker is an intermediary that provides traders with access to financial markets, infrastructure, and executes trading orders.
CFD (Contract for Difference). CFD is a financial contract that allows traders to profit from changes in the prices of assets such as stocks, currencies, commodities, and indices without actually buying or selling the asset. CFDs enable traders to profit from both rising and falling prices.
Brokers offer clients the opportunity to trade CFDs on various assets such as stocks, currencies, commodities, and indices. Thanks to brokers, traders can profit from price changes in assets without actually acquiring them.
Trading Platform. A trading platform is software traders use to analyze markets, place orders, and manage their investments.
Brokers provide traders with trading platforms that include tools for market analysis and order placement.
Now that you have an understanding of the basic types of markets, trading platforms, and the role of a broker, we are ready to move forward.

Choosing a Market
For a beginner trader, one of the first and most significant steps is choosing a specific market for trading.
How to Choose a Market for Trading
- Goals and Interests. An important step is to identify your interests. For example, if you are interested in new technologies, consider looking at the stocks of hi-tech companies. If you are drawn to the global economy, Forex might be a good choice.
- Risk and Volatility. Different markets are characterized by varying levels of risk and volatility. For instance, cryptocurrencies are known for their high volatility, while trading in the stocks of large companies is less subject to fluctuations.
- Accessibility and Liquidity. Ensure that the chosen market is accessible to you, and its assets are easy to buy and sell. Liquid markets typically have narrow spreads and low commissions.
- Timeframes. Timeframes play a crucial role in differentiating between trading and investing. In trading, the emphasis is on short-term timeframes, where the goal is to profit from rapid price fluctuations. Traders can execute operations within days, hours, minutes, or even seconds. Investors focus on long-term perspectives. They buy assets with the intention of holding them in their portfolios for much longer periods, which can extend to years or decades.
- Market Research. Conduct research on the selected markets, studying their trends, historical performance, and relevant news and events that may impact them.
Creating a Trading Strategy
After you have chosen the market and asset, the next important step is to build a solid trading strategy.
Defining Your Financial Goals
Before you start trading, it’s crucial to clearly define your financial goals. This will help you focus on the end result and develop a strategy aimed at achieving them. Here are some key steps:
- Setting Specific Goals. Your goals should be measurable. For example, “Earn $10,000 in a year” or “Increase my capital by 20% in six months.”
- Considering Timeframes. Determine when you would like to achieve your goals. These can be short-term (a few weeks or months), medium-term (several months to a year), or long-term (a year or more) goals.
- Risk Assessment. Analyze the risks that may arise on your path to achieving your goals and prepare for them.
After defining your financial goals, proceed to develop a trading strategy aimed at achieving them. Here are some key aspects:
Developing a trading strategy
- Choosing the Type of Strategy. Decide whether you want to use a long-term strategy focused on investing and holding assets or a short-term strategy based on frequent trades. It’s important to choose a strategy that aligns with your goals and risk tolerance.
- Research and Analysis. Study the market and the chosen asset. Conduct technical and fundamental analysis to identify optimal entry and exit points.
- Risk Management. Develop a risk management strategy, including setting stop-loss levels and determining the risk-to-reward ratio for each trade.
- Discipline. This is crucial! Strive to adhere to your strategy and avoid making emotional decisions.
Your trading strategy should be flexible and adaptable to market changes. Don’t hesitate to modify your strategy if the situation requires it. Remember that trading involves not only the opportunity to earn but also the risk of losing funds. Defining financial goals and developing a strategy will help you manage risks and increase your chances of success in trading.
Basics of Technical and Fundamental Analysis
After you have chosen the market, asset, and developed your trading strategy, it’s time to delve into market analysis. This stage will help you make informed decisions about entering and exiting trades. Let’s get acquainted with the basics of technical and fundamental analysis.
Basics of Technical Analysis
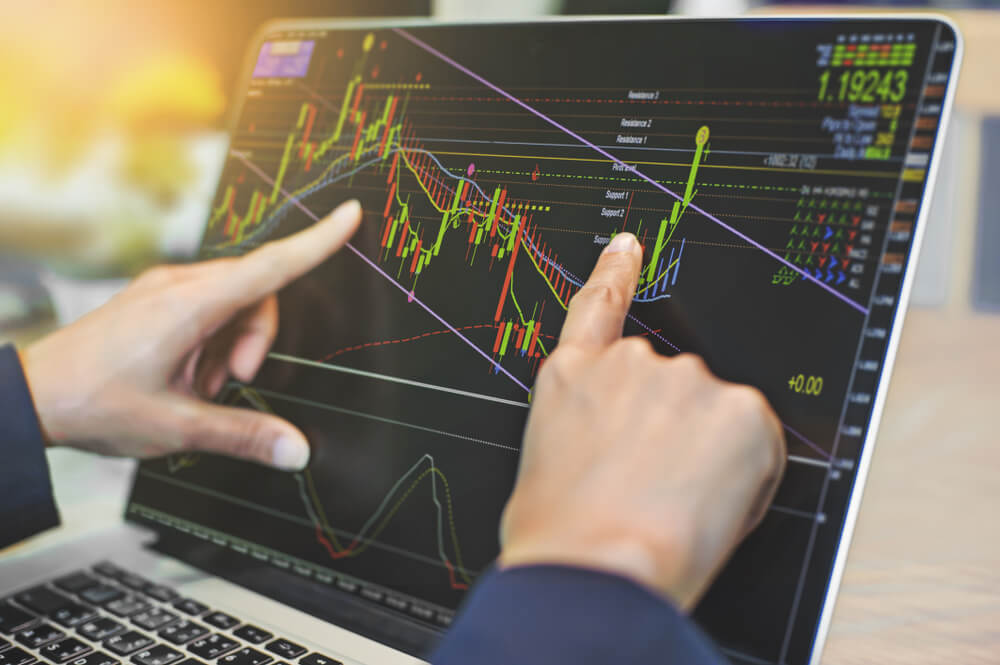
What are Charts and How to Read Them
Charts are an essential tool for traders that visually represent price movements in the market. The primary elements of a chart include candlesticks (Japanese candlesticks), bars, and line charts. Reading charts involves analyzing patterns that help forecast price movements.
Key Indicators and Their Application
Technical indicators are mathematical tools used by traders for in-depth analysis of financial markets and decision-making in trading. They are based on calculations and statistics, aiming to identify specific patterns in price and volume movements. These indicators assist traders in understanding the current market condition and its potential development.
Popular technical indicators include:
- Moving Averages: These indicators smooth out price data and help identify the overall trend direction. For example, an upward-sloping moving average may indicate an uptrend, while a downward slope may signify a downtrend.
- Relative Strength: This indicator helps determine how an asset is performing in the market. High relative strength may indicate a strong trend, while low relative strength can signal weakness.
- Stochastic Oscillator: The stochastic oscillator helps gauge whether prices may be overbought (too high) or oversold (too low), assisting traders in decision-making.

Fundamental Analysis
Analysis of News and Market-Impacting Events
Fundamental analysis is based on studying factors that can influence asset prices. This includes analyzing news, events, and company announcements that may impact the market. News such as central bank decisions on interest rates or geopolitical events can significantly affect asset prices.
Important Economic Indicators and Their Impact
Key economic indicators that often affect financial markets include:
- GDP (Gross Domestic Product): Measures the total value of all goods and services produced in a country over a specified period. GDP growth signals a healthy economy.
- Inflation: The rate of price increase for goods and services. High inflation can reduce purchasing power and influence trader and investor decisions.
- Unemployment: The percentage of people actively seeking employment but unable to find jobs. High unemployment levels can indicate economic problems.
- Interest Rates: The rates set by central banks for lending to commercial banks. Interest rates affect borrowing costs and investment decisions.
- Trade Balance: The difference between a country’s exports and imports of goods and services. Trade deficits or surpluses can impact currency exchange rates.
- Consumer Price Index (CPI): Reflects changes in average consumer prices for a basket of goods and services. Rising CPI can signal high inflation.
- Industrial Production: Measures the volume of output from manufacturing, mining, and utilities. It provides insights into the state of the industrial sector.
These economic indicators have a significant impact on financial markets and help traders and investors make informed decisions based on fundamental analysis.
In the first part of this guide, we covered theory. What awaits you in the second part? Practice. We will explore how to choose a broker, open an account, and execute your first trade. Stay tuned for our updates to ensure you don’t miss important information on mastering trading. Good luck on your journey to successful trading!
Recommended reading: