
Japanese candlesticks are among the most widely used tools for analyzing financial markets. They offer traders crucial insights into price movements and can help predict future trends. In this article, we’ll walk you through how to interpret candlestick charts.
Article content
How to Read Japanese Candlesticks
Candlesticks are a graphical method of displaying price data in financial markets, commonly used in technical analysis. They illustrate price movements over a specific time period (like a day, hour, or minute) and comprise a few key components:
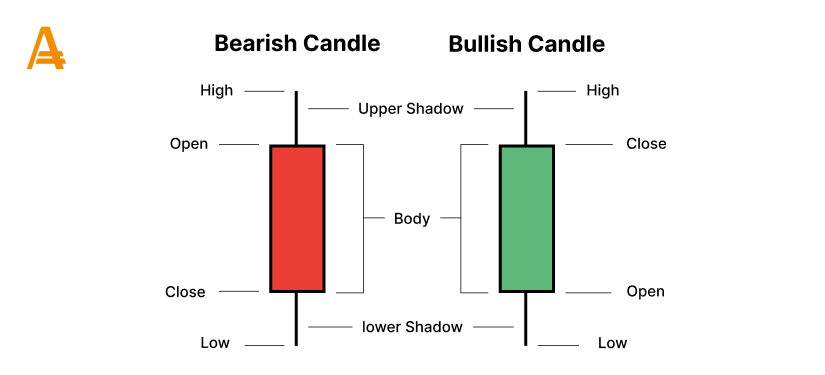
1. Real Body: This is the wide part of the candlestick that represents the price range between the open and close of the selected period.
- A red candlestick (bearish candle) indicates that the close was lower than the open, signaling seller dominance.
- Conversely, a green candlestick (bullish candle) means the close was higher than the open, suggesting buyer dominance.
2. Shadows (also referred to as wicks): These are the thin vertical lines extending above and below the real body, indicating the highest and lowest prices for the period. The upper shadow represents the high price, while the lower shadow shows the low.
Now let’s break down what these elements signify:
- A long body in a bullish candle indicates strong buying interest, while in a bearish candle, it indicates selling pressure.
- A short body signifies a small difference between the opening and closing prices and indicates indecision among market participants.
- Long shadows indicate significant price fluctuations during the trading session, with the closing price being close to the opening price. This may indicate fluctuations in trader sentiment.
- Short shadows or no shadow at all indicate that most of the trading action was confined near the open and close for the period under consideration, reflecting strong market pressure in a certain direction..
Japanese candlesticks can be analyzed independently or in combination with other technical analysis tools for more accurate price movement forecasting.
Understanding Candlestick Patterns
Candlestick patterns are specific formations on a price chart, created by one or more Japanese candlesticks. Traders and analysts use these patterns to predict future market movements, indicating potential reversals or continuations of the current trend. Let’s explore some of the most popular candlestick patterns.
Hammer and Inverted Hammer
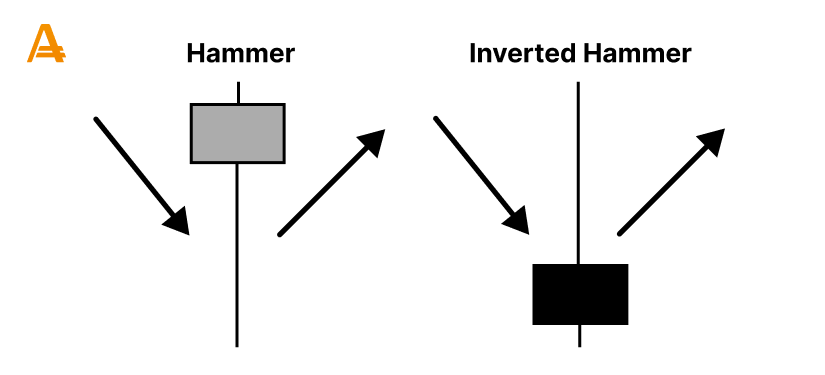
The Hammer pattern suggests a potential price increase after a decline. It appears as a candlestick with a small body and a long shadow extending downwards. When the long shadow is positioned above the candle body, this pattern is called an Inverted Hammer. While the candle color isn’t a determining factor, green formations are typically seen as stronger signals.
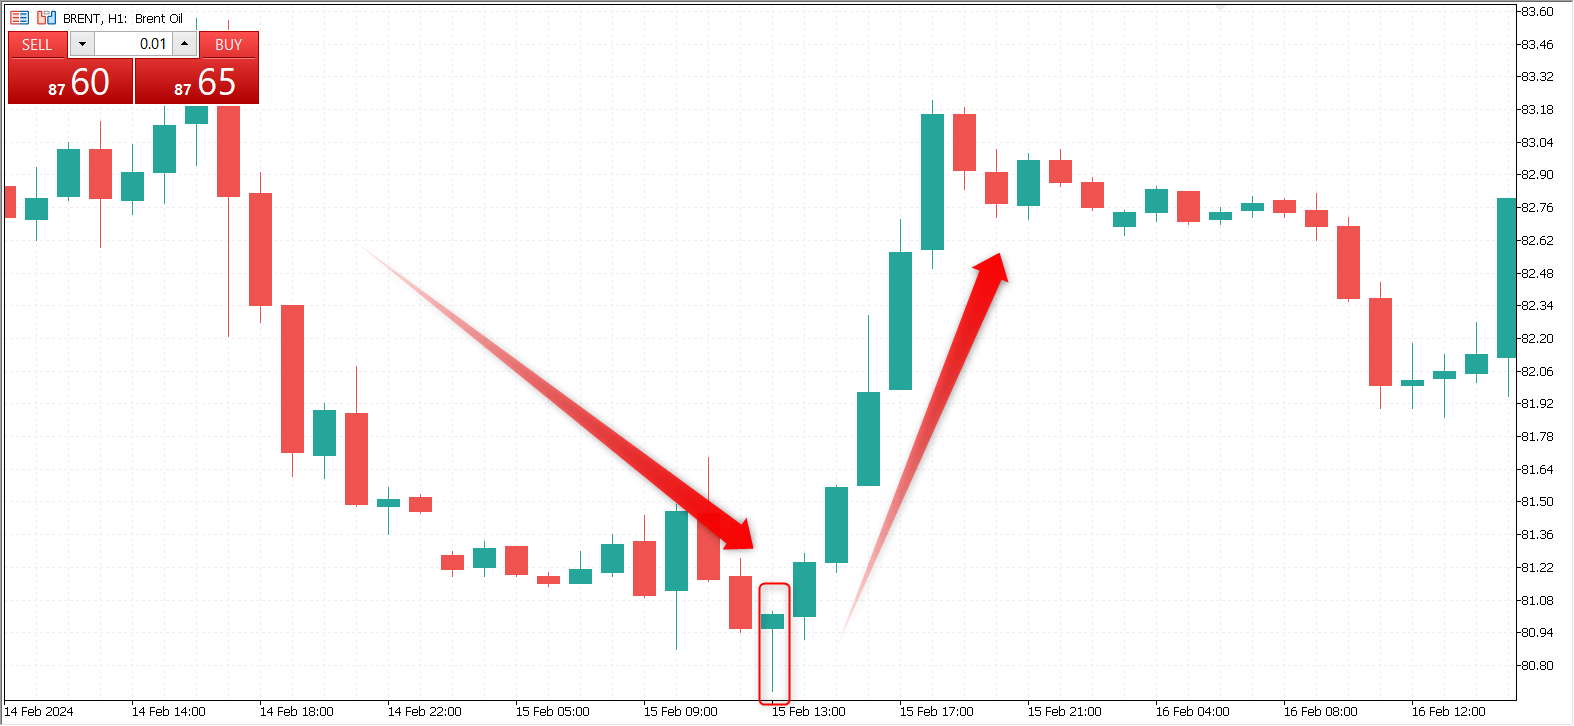
In the provided example, the Hammer pattern is illustrated, spotted at the lower border of market activity. This formation indicates the end of a downtrend and the beginning of an upward movement.
Shooting Star and Hanging Man
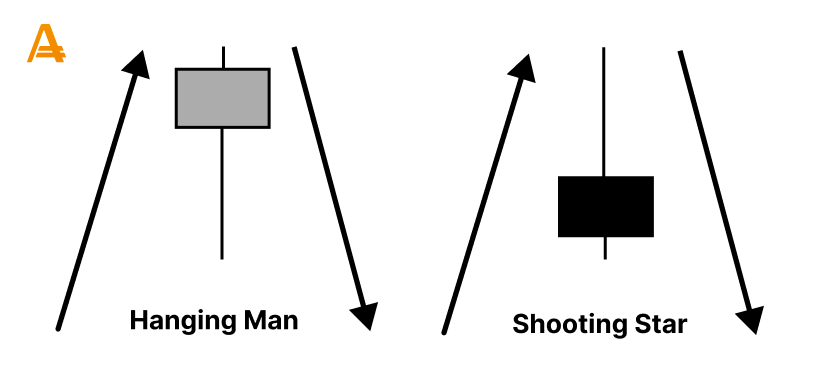
These patterns share similarities with hammers in shape but differ in placement. The Shooting Star and Hanging Man form at the peak of market activity. Both patterns feature small bodies and elongated shadows. The Shooting Star’s shadow extends upwards, while the Hanging Man’s shadow points downwards, suggesting potential trend reversals.
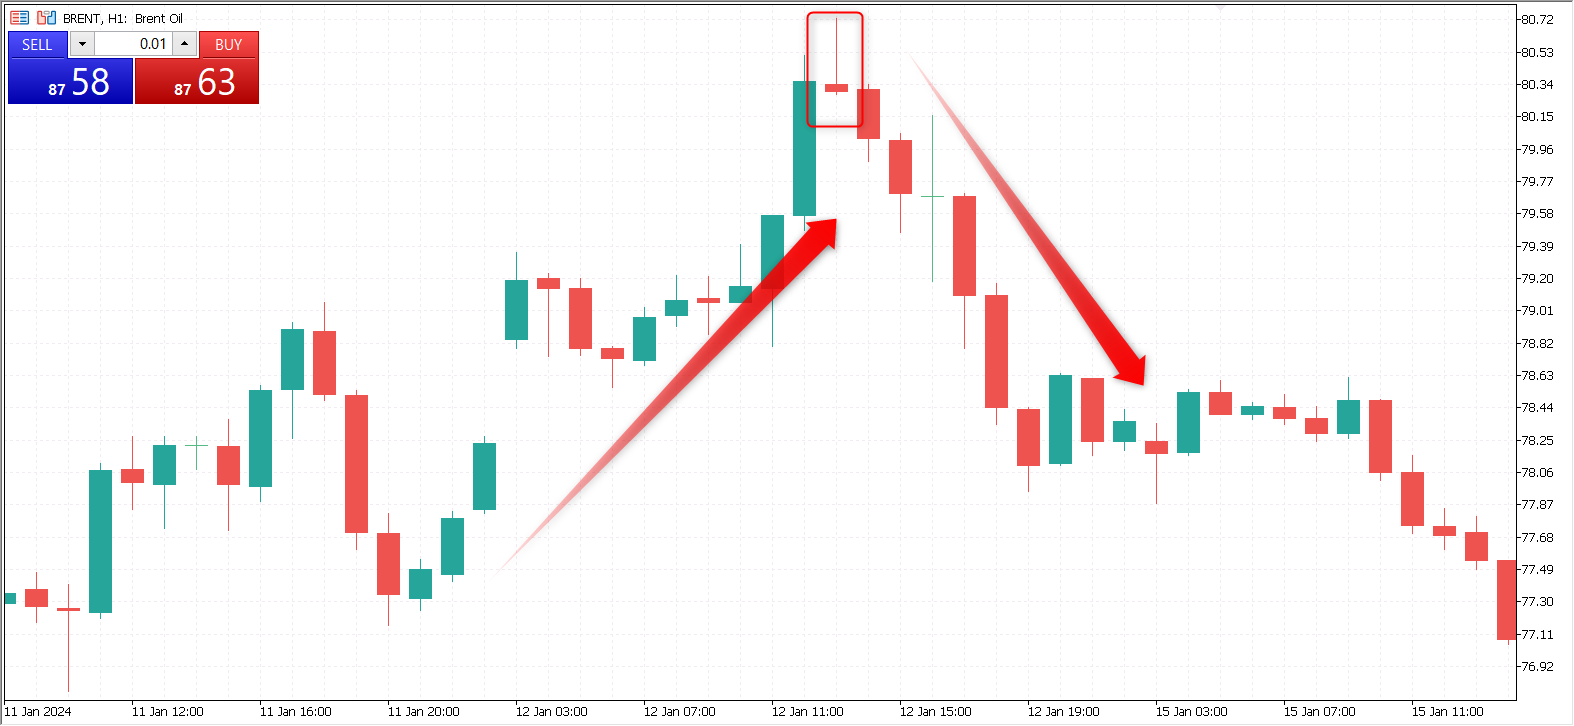
The Shooting Star often emerges at resistance levels, signaling the end of an uptrend. It’s characterized by a small red (or sometimes green) body and a long upper shadow, hinting at a possible trend reversal and a shift in market sentiment.
The Hanging Man occurs at market peaks like the Shooting Star but suggests a potential end of the uptrend. It features a small real body, located at the upper end of the trading range and a long lower shadow, which is significantly larger than the body. The candle body can be red or green, but a red body is typically considered a stronger reversal signal, reflecting buyer doubts. When this pattern appears at the peak of an uptrend, it warns of potential momentum change and the beginning of a downtrend.
Bullish and Bearish Engulfing
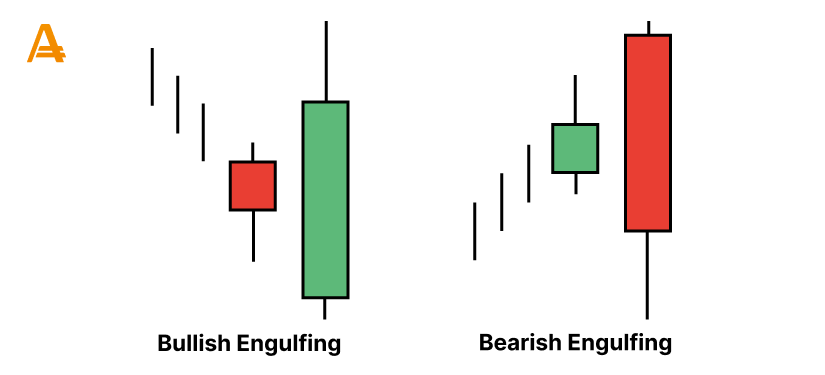
Unlike single-candle patterns, Bullish and Bearish Engulfing patterns are formed by two candles of opposite colors.
The Bullish Engulfing pattern typically emerges at support levels, starting with a red candle that is entirely engulfed by the subsequent green candle. When the green candle closes above the red one, it serves as a buy signal for traders.
Bearish Engulfing is encountered at the peak of market activity and starts with a green candle, followed by a larger red candle that completely engulfs it. This pattern signals potential weakness in the market. Closing below the green candle may be a sell signal.
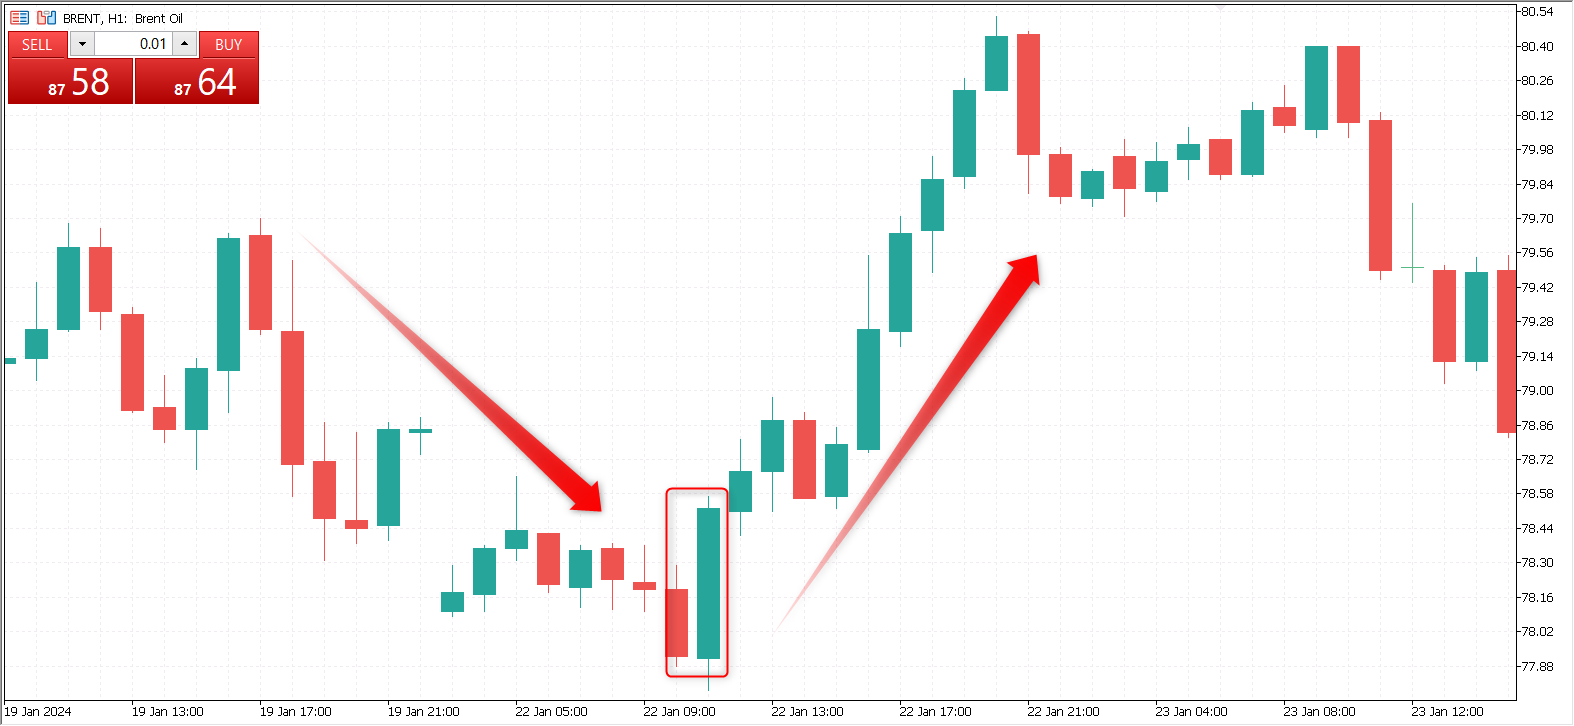
The example above illustrates the Bullish Engulfing pattern, which occurs at a support level after a downtrend. Here, the green candle fully engulfs the preceding red one, signaling a reversal and the start of a price increase.
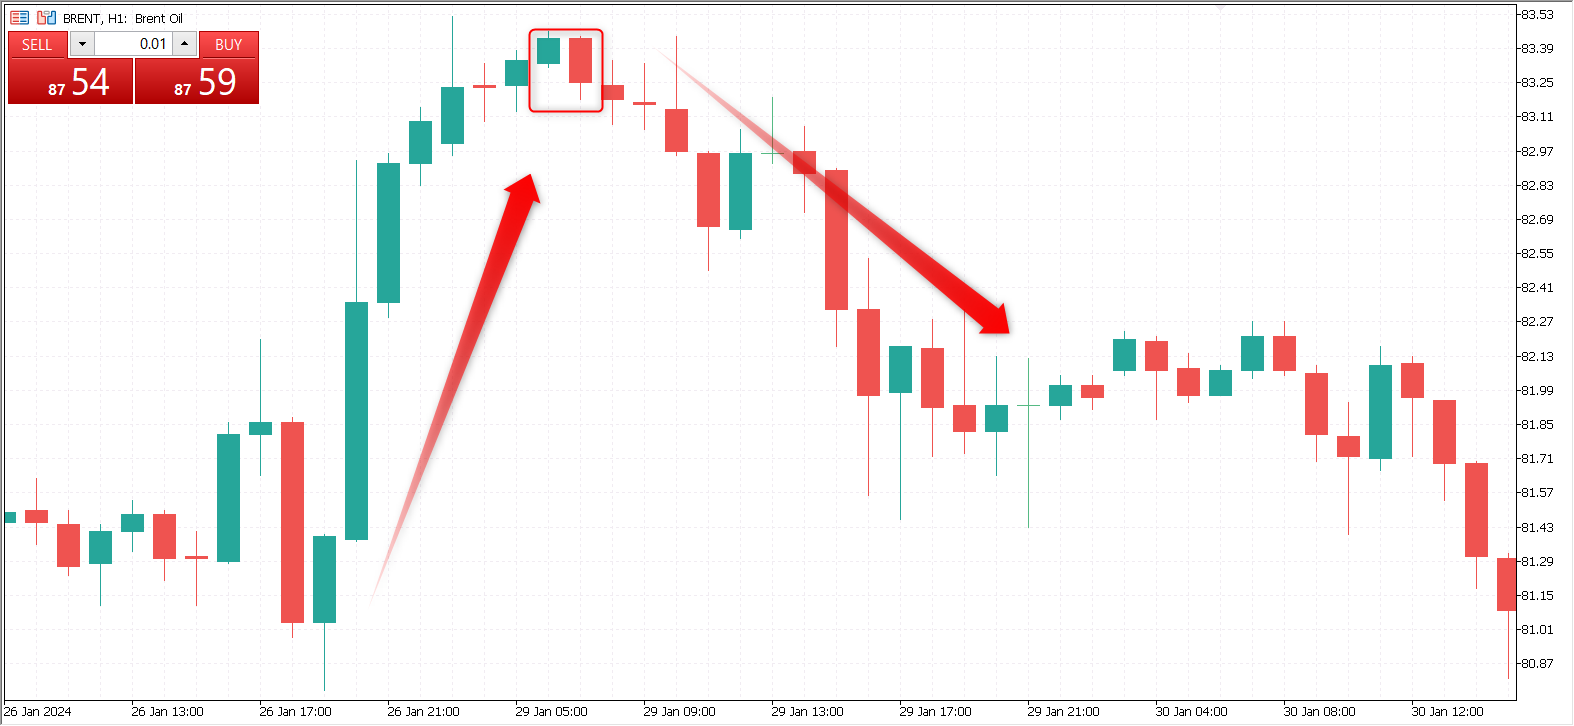
The Bearish Engulfing pattern typically occurs at or close to key resistance levels. This happens after the price reaches its local or key high as a result of a swift upward movement or a steady uptrend. Then, the bearish candle fully engulfs the previous bullish one, marking the beginning of a potential reversal. It’s important to note that this signal may not necessarily indicate a strong reversal but rather a mild correction.
Mastering Japanese Candlesticks: Essential Trading Tips
Here are some recommendations for effectively working with Japanese candlesticks to enhance your trading decisions:
- Combine with Other Indicators: Use candlestick pattern analysis in combination with other technical indicators like moving averages or support and resistance levels. This can help confirm trading signals and improve their accuracy.
- Analyze Across Several Timeframes: Assess candlestick patterns across different timeframes, ranging from short to long-term. This allows you to select the most appropriate pattern for your trading strategy and gain deeper insights into market trends.
- Consider Trading Volumes: Take trading volumes into account. High trading volumes often confirm the validity of a candlestick pattern.
- Stay Informed: Stay updated on current market conditions and economic events that may impact the relevance of candlestick patterns. External factors can influence market sentiment and affect the reliability of trading signals.
- Exercise Patience: Avoid making impulsive decisions based solely on individual candlestick formations. Instead, wait for confirmation from other indicators or patterns before placing your trades.
- Manage Risks: Implement risk management strategies such as setting stop-loss orders to mitigate potential losses and managing position sizes. Remember that not all signals will result in profitable trades.
By following these recommendations, you can leverage Japanese candlesticks more effectively in your trading activities and make more informed decisions in the financial markets.
Japanese candlesticks offer powerful insights into market sentiment and price dynamics, making them essential for technical analysis. With these tools, traders can identify trends and crucial trading signals. Continuously refine your candlestick analysis skills, and don’t forget to subscribe to our Telegram channel to get valuable trading ideas and stay updated on relevant news, current promotions, and reviews.
Recommended reading: