To earn on foreign exchange market, you need to compete with professional players, such as banks, investment funds and companies.
Article content
Forex market professionals analyze all the available information and instantly make their decisions. You cannot afford lagging behind them. To be able to compete with the best, here is what you should know:
- how the world’s economies are related;
- what affects currency rates;
- what to be guided by when making your analysis.
Here is your manual for yen trading for 2021. We are going to tell you what you need to know about the USD/JPY pair. We’ll also specify the essential factors which affect the exchange rate of Japanese currency.
Our initial plan was to arrange the article into 3 parts:
- Market players;
- Fundamental factors; and
- Technical analysis and Forecasts.
But all of the above are closely related, so we’ve made another plan. And the history of yen is what we’re gonna start with. Cause, you know, there is a Japanese wisdom saying: “Beginning is the most important thing”.
History of Yen
Yen (JPY) is a money unit of Japan and the world’s third currency in terms of turnover after US dollar and euro:
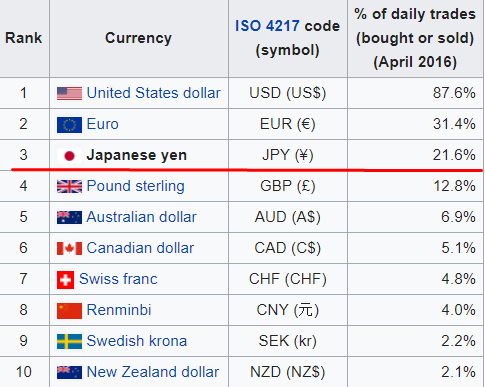
Fifth of the world’s money is kept in yen
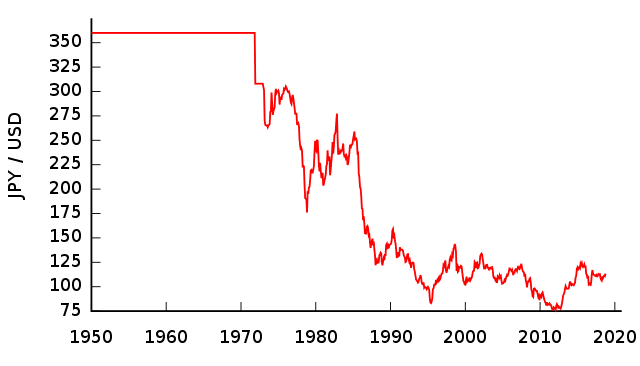
After the Second World War, Japanese economy was devastated. Due to the weak economy, yen depreciated and was undervalued. To restore the national currency exchange rate, the Central bank of Japan (known as just ‘the Bank of Japan’, or BoJ) established a fixed rate of Yen to USD in 1949: from thereon, ¥360 were paid for $1.
Such a decision was a part of the Bretton Woods Agreement on peace established after the World War II by the USA for the countries that had suffered from the war.
After the USA withdrew from the Agreement 20 year later in 1971, the Bank of Japan unpegged yen from the fixed rate of ¥360 per $1. The unit price of yen became floating, and during 1971-1973, the Japanese currency grew from ¥360 to ¥271 per $1.
Currently, 1 USD costs 105 Yens. Since the war, value of Japanese currency has become three times larger:
The key market player that has been historically affecting the yen exchange rate is the Bank of Japan, which will be our further subject matter of the story.
The Bank of Japan
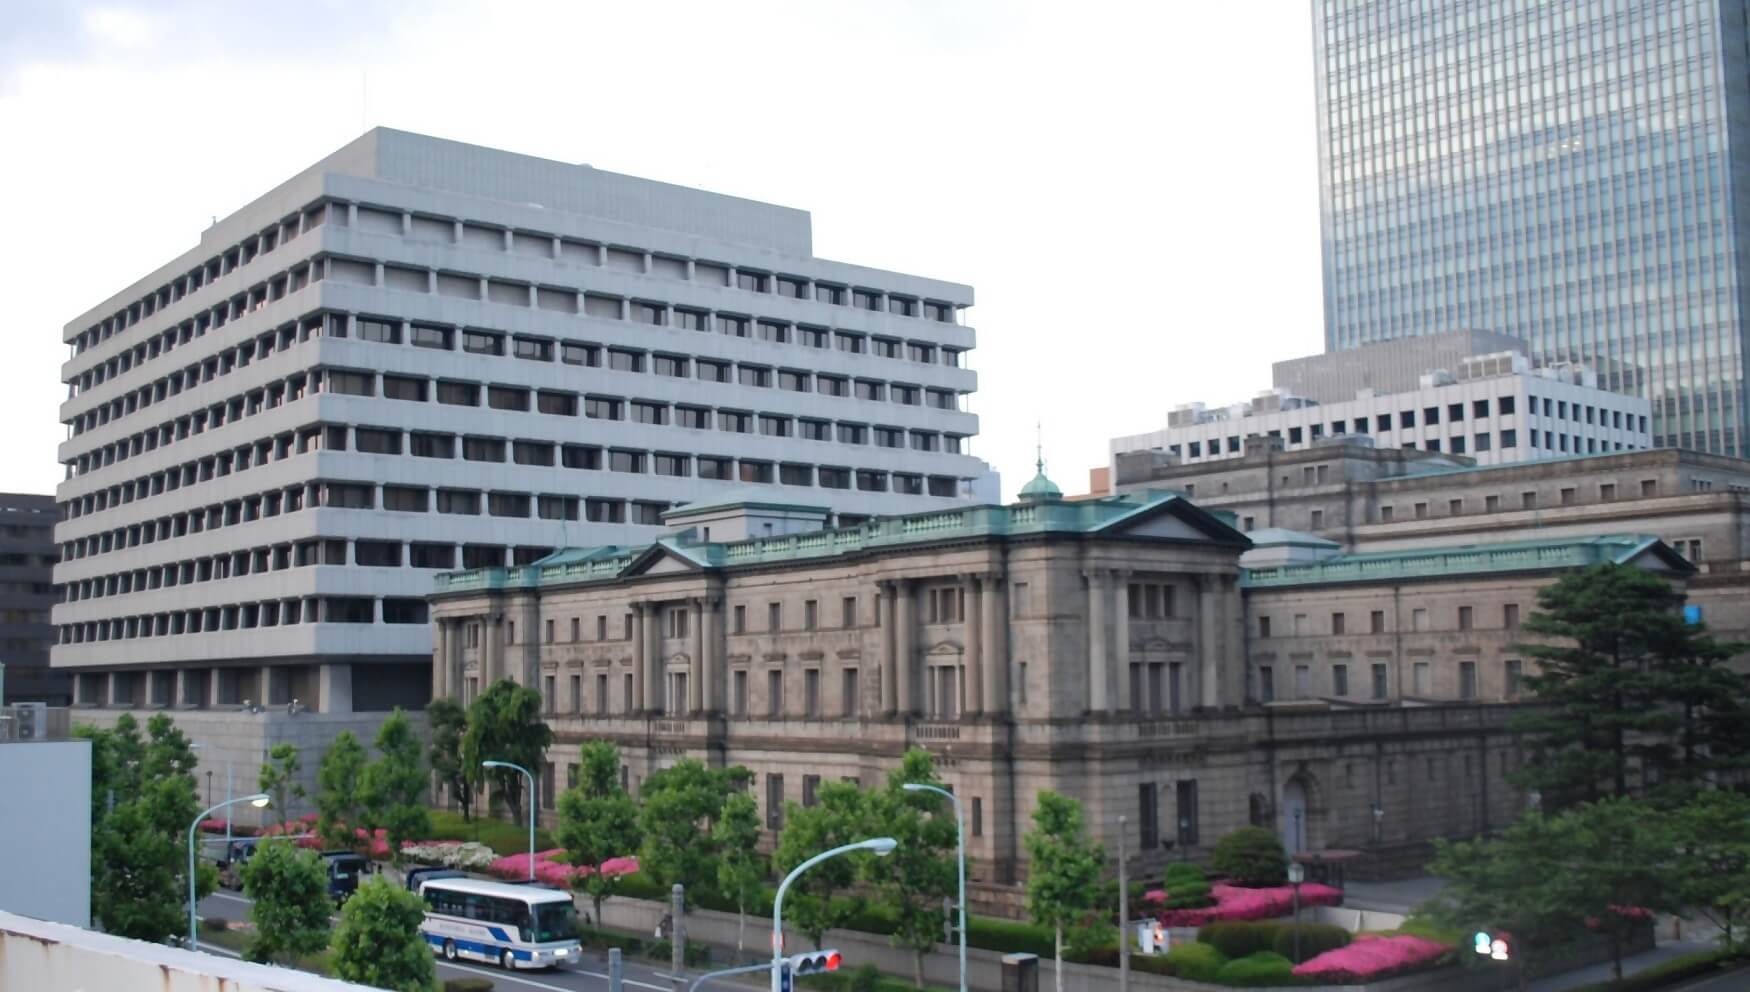
An old building in the center is the Bank of Japan
When the USA had refused from using the Bretton Woods system in 1971, the exchange rate of yen went up and continued increasing every year. Japanese government was concerned by yen getting stronger: the country wanted to improve its economy due to export activities, to which high value of yen was an obstacle.
For export to be profitable, foreign investors needed cheap yen for them to buy Japanese goods at favorable prices. For this reason, the Bank of Japan decided to weaken the national currency.
In 1973, the Bank of Japan pursued a number of financial interventions by buying and selling dollars and yens to knock down the exchange rate of the Japanese currency.
The currency market had become open by then, so anybody was able to buy and sell USD and yen. In addition to Bank of Japan, other players also participated in the speculations:
- Central banks of other countries (the USA, the UK, other European countries);
- financial investment funds and local banks;
- private Japanese and foreign investors.
Despite regular interventions from the Bank of Japan, it didn’t manage to knock off the exchange rate, and yen grew from ¥250 up to ¥150 per $1 during 1980’s through 1990’s.
Revanche of the BoJ: Key Interest Rate
Management of the Bank of Japan realized that interventions only bring some short-term effect. So, beginning from 1990’s the Bank of Japan decided to offer cheap credits, to facilitate active spending of yen.
From 1993 through 1998, the interest rate on credit dropped from 6% to zero, and has been remaining such for nearly 20 years now:
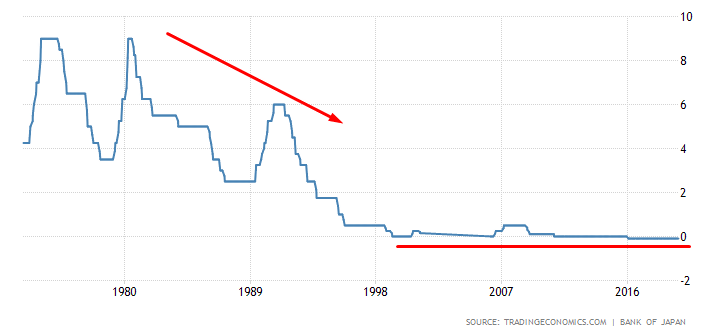
A zero-interest rate means that when you get credit funds in yen, you are asked nothing in return. For example, you were given 5000 yens, and that’s exactly how much you have to return.
When the BoJ made a zero key interest, this resulted in a cheap yen, because:
- people started taking credits more willingly. The more money people have available, the more they spend on goods and services, thus selling yen and affecting the currency: the exchange rate is dropping down;
- investors also started taking loans in Japan and investing yen into economies of countries which enjoyed dynamic development. Typically, they would receive credit facilities in yen to buy dollars which they further invested into the economy of the USA.
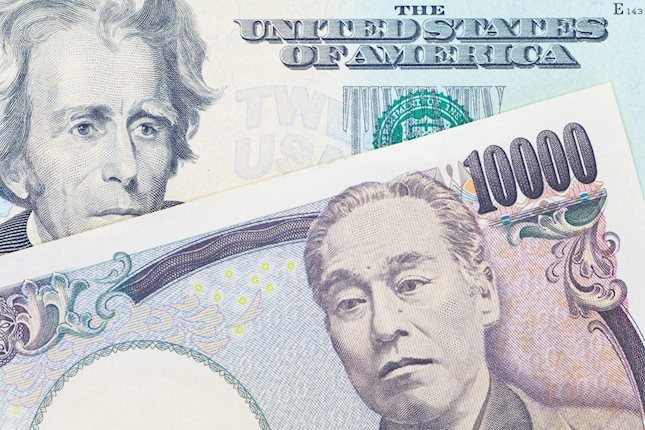
Economy of the USA
Speaking of yen, we compare it with US dollar. At Forex, relation between dollar and yen is represented in a pair of dollar / yen (USD/JPY).
Yen has its own Central bank which uses interventions and a key interest rate to control the currency.
To make efficient forecasts of USD/JPY exchange rate, information from the Bank of Japan is not enough. We also need to know the activity of another party to the dollar/yen pair, which is the USA. That is why traders keep track of the US’s Central bank, which is Federal Reserve System, or FED.
The Race of the Two Banks
All Central banks manage their currencies in a similar way:
- by increasing and reducing the key interest and regulating the money flow in a country;
- by printing out new money if the key interest brings no effect;
- by restraining inflation from growing too fast;
- by controlling unemployment and preventing it from growing above 3-5%.
These are fundamentals of a trader for analyzing countries’ economies and currencies. If the government doesn’t fail, and the fundamental factors are stable, the country is going to have strong currency.
For fundamental analysis of yen, follow the news and reports on monetary policy of Central banks of both Japan and the USA. Check out the main events in the economic calendar.
Policy
Governments pursue different monetary policy to manage money flow. But there is also another side of the policy, which is relations between the countries.
President and Parliament are the key political figures. It is them who manage social situation in a country
Heads of State of the USA and Japan
Donald Trump, President of the USA, and Shinzo Abe, Prime Minister of Japan:
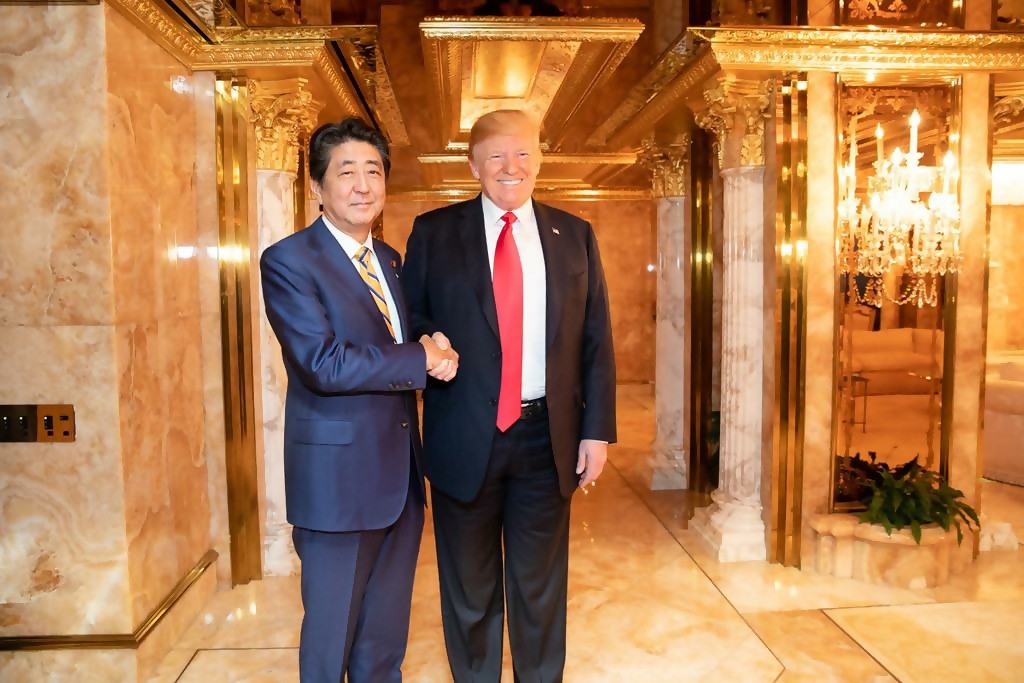
Heads of state are key figures of the economies. Traders keep an eye on their verbal interventions – words, to foresee which way the currency rate will go.
In addition to press conferences and meetings, Twitter is another source where one can find ideas expressed by heads of states:
The fact is that traders do forecast currency rates based on twits.
Usually, heads of countries only make hints about the future in the country, but sometimes they actually speak out what they think.
If Trump says oil is expensive, traders will start selling oil.
To figure out how to analyze presidential twits and verbal interventions, get an insight into articles about similar situations in the past.
Examine the Past and You’ll Understand the Present
Relation between currencies in the past and in the present is studied by technical analysis, which is an art of reading charts.
How to Read the USD/JPY Chart
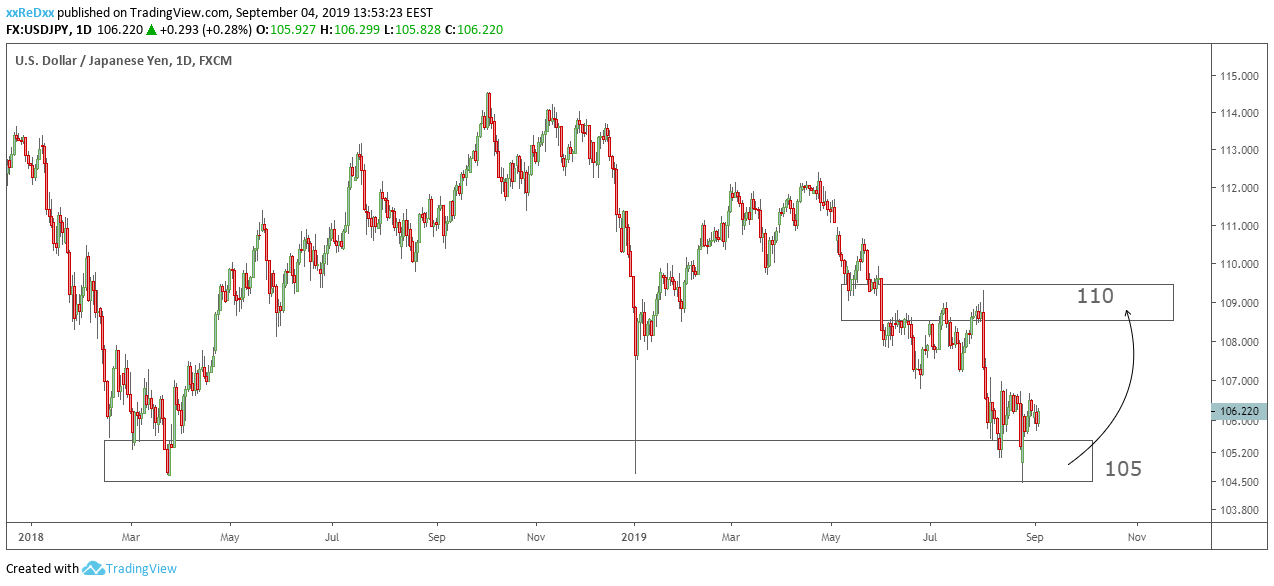
Yen goes second in the pair of USD/JPY. Newcomers often get confused when they read quotes of the dollar/yen pair:
- when the dollar / yen chart goes down, this indicates that US dollar is dropping, while yen is growing;
- when the USD/JPY chart goes up, it actually means that US dollar is growing, while yen is dropping.
In the chart below, USD/JPY goes down: dollar is reducing, yen is increasing:
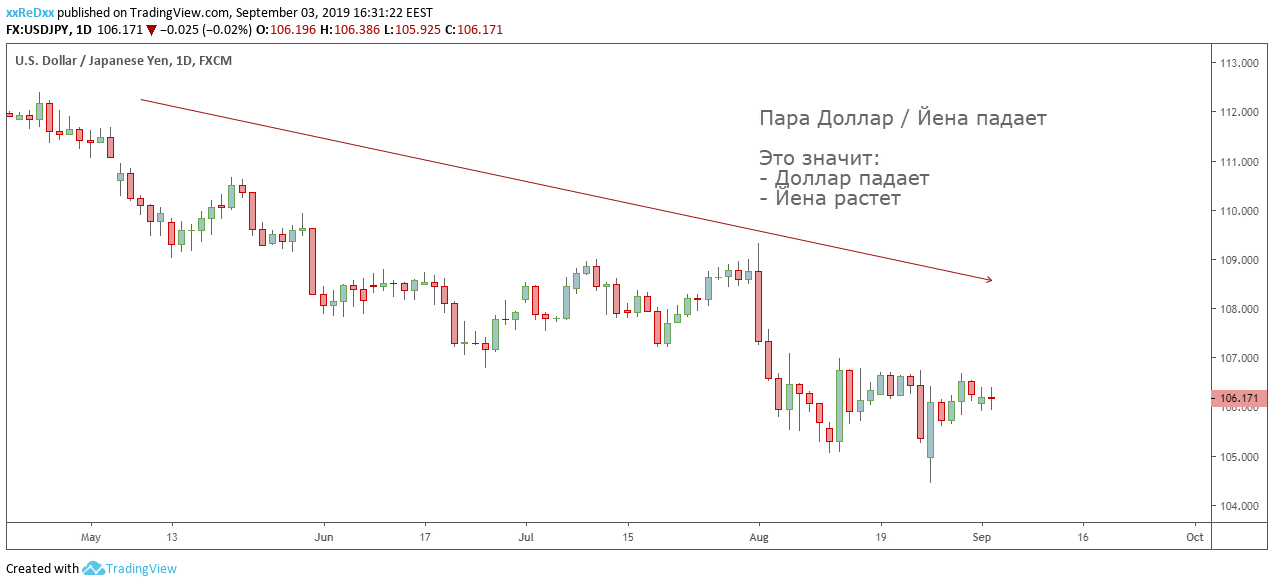
Don’t get confused: dollar is going down while yen is going up
Have a look at the scale to the right of the chart: the fewer yens are paid for the dollar, the stronger the Japanese currency is. In the example above, yen grew from 112 up to 106.
Let’s figure out how traders read the chart and find spots to open deals.
The Right Spot in the Chart
Technical analysis trains a trader to look for key spots at the chart using patterns which are templates repeated for centuries.
Patterns are repeated because people are predictable in their money-related decisions. Whenever a trader speculates, he or she gets excited, angry and happy just as their ancestors did 500 years ago.
The Most Popular Pattern
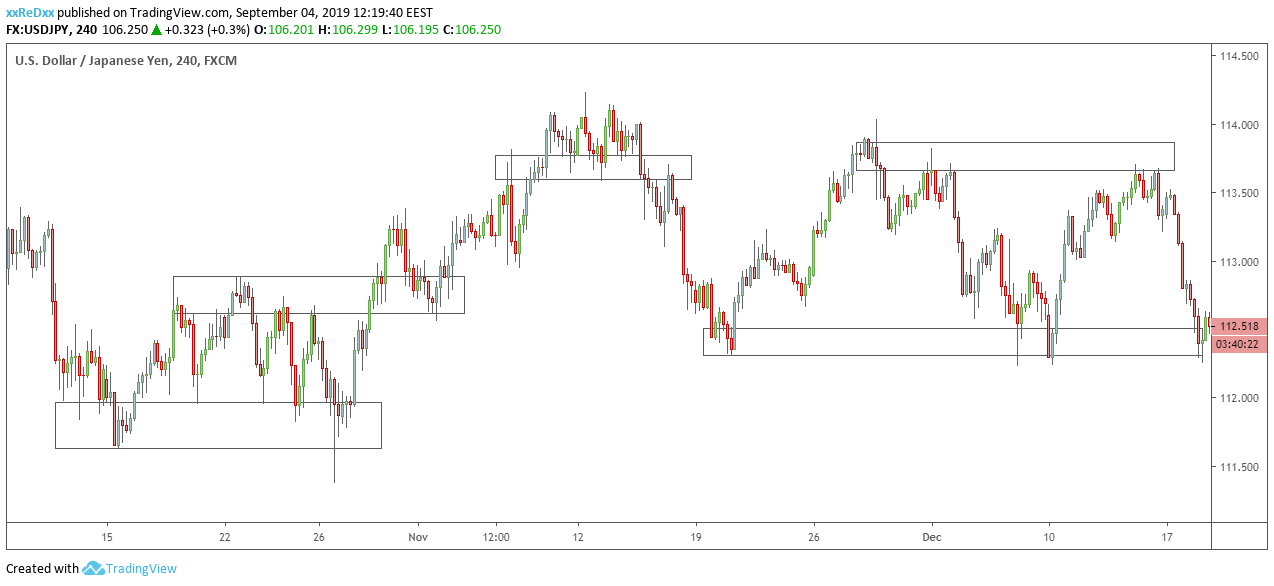
The most popular pattern at the chart is areas of demand and supply.
All the market players have regard for those areas. They can be better distinguished at a daily timeframe:

USD / Yen, daily chart. The supply area is above, the demand area is below.
At this dollar/yen chart we can see the area where the price reversed several times. It is demand and supply that are managing the dollar to yen exchange rate.
Demand and supply are the main driver of any share, any currency and any asset. The demand and supply areas can be found at any chart.
How to Figure Out Demand and Supply
What does demand-and-supply mean in terms of USD/JPY pair?
Demand for JPY is willingness of the market players to sell a dollar in order to buy a yen. Having yens you’ll be able to:
- buy goods and order services in Japan;
- invest the money in Japan’s economy: buying real property, starting a business and investing into Japanese shares.
Supply for JPY is when you sell yen to buy dollars for further purchasing goods and services from the USA.
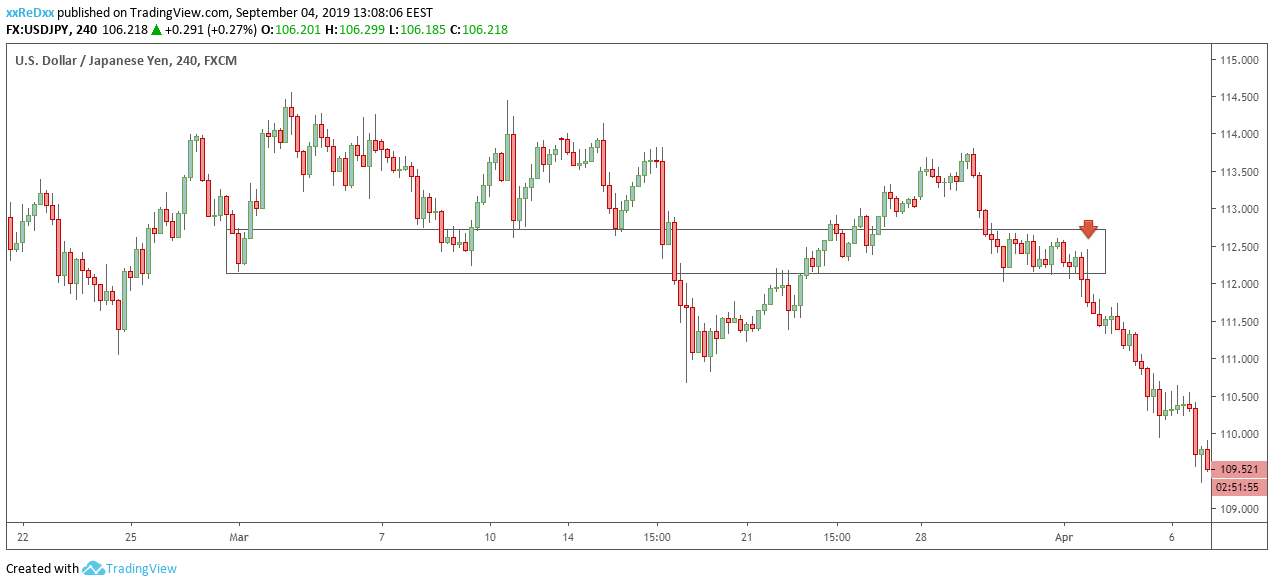
How to Locate Areas of Demand and Supply at a Chart
Demand and supply areas can be seen at the chart:
At the chart above, the demand areas can be seen below the chart and indicate the exchange rate where traders buy dollars and sell yen. The supply areas can be seen above the chart and indicate the exchange rate where traders sell dollars and buy yen.
To locate the demand-and-supply area, find the segment in the chart where the trend was seen to reverse 2 or more times. More often and stronger price reversals at the area indicate a stronger price.
How to Find Reversal in the Chart
Traders are waiting for reversal at the demand-and-supply areas and confirm reversal by technical patterns:
- candles;
- chart patterns;
- indicators.
Candlesticks are most commonly used to determine the price reversal:
Example of reversal candlestick at the supply area
If you want the candlestick setup more likely to work out, trend trading at the demand and supply area is recommended.
By using technical analysis patterns, you can forecast prices in financial markets.
For the most efficient forecast, traders use both technical and fundamental analyses in conjunction.
Public Forecasts
Central banks, investment funds and analytical centers regularly publish the information used by traders to make forecasts, including a dollar/yen forecast. This information comes from original sources, and, what’s most important – it is free.
We made a list of resources where you can feed yourself with new investment ideas. Once a weak, check out the links for new information.
Ideas from Morgan Stanley
Morgan Stanley, a multinational investment bank, makes regular publications on macroeconomics. Subscribe for the mail-out and listen to audio podcasts.
CitiGroup Analytics

CitiGroup, and American multinational investment bank publishes information for investors: forecasts about the countries’ economies, ROA, and key interest rates of central banks.
You may follow the news about key interest rate of the Bank of Japan and examine the economic situation in the USA, guided by ideas from experienced CitiGroup’s traders.
Insights from BlackRock

BlackRock bank offers fresh insight on the currency market. Once a week they publish new articles and audios at the website.
Forecast for USDJPY
Most analytics bet on short-term hardening of yen within a month or two.
Traders bet that the demand area at a round-number level of 105 will constrain the price and that USD/JPY exchange rate will grow up to 110. Yen will drop, while dollar will grow:
Afterword
It is time to bottom line and to make a check list for USD/JPY analysis. The recommendations below will be valid for more than one year.
We have covered the history of Japanese currency and learned about the roles that Central banks play in the countries’ economies. Now you know how Central banks control money flow using key interest rate, and which macroeconomic information to consider when making analysis.
Here is the fundamental check-list for USD/JPY:
- check out the meetings of both the US and Japan’s Central banks.
- be aware of any changes of the key interest rate in both countries;
- keep monitoring inflation level, unemployment level, and GDP.
Now and then, see what’s being published in twitter accounts of the US President Donald Trump, and of Prime Minister of Japan, Shinzo Abe
To make a forecast, learn the history of USDJPY price with basics of technical analysis:
- use the demand and supply areas to find the pivotal reversal points in the chart;
- Use the trend trading. Beware of flat market;
Use the candlestick analysis to enter the market. Did you know that candles have been invented in Japan, the native land of yen?
We recommend that you read public forecasts issued by banks and investment funds, but don’t get too much enchanted: even though analysts of large banks like Morgan Stanley or BlackRock are armed with accurate information, they get mistaken just as retail traders do.
This ‘Yen Guideline’ can be relevant not only for the USD/JPY pair. You are free to use it to analyze other currency pairs in future. Don’t surrender to your emotions and follow your trading strategy.