In trading, price charts can feel like a fast-moving ocean. Among all the tools traders use to navigate it, the RSI indicator is like a simple compass that helps you understand when the waves of momentum are getting too strong or starting to fade.
For beginners, it’s one of the easiest ways to read market “breathing patterns” and spot potential turning points.
Article content
What Is the RSI Indicator?
The RSI indicator (Relative Strength Index) is a momentum indicator that measures how fast and how strongly the price is moving. Think of it like a “speed gauge” for the market:
- If the market is racing too fast upward, it may be overheating.
- If it’s falling too quickly, it may be exhausted.
This helps traders identify overbought/oversold RSI conditions before the market potentially slows down or reverses.
How RSI Works
RSI moves between 0 and 100 and acts like a speedometer for market momentum. When the indicator climbs higher, it shows buyers are stepping on the gas. When RSI falls lower, sellers are taking control of the wheel.
Most traders keep a close eye on the 70 and 30 levels. Once RSI pushes above 70, the market may be running too hot after a strong rally. When it drops below 30, it often signals the selloff is becoming exhausted and running out of steam.
In other words, RSI helps traders spot moments when the market may have stretched too far in one direction and could be ready to cool off or reverse course.
Best RSI Settings for Different Trading Styles

Choosing the right settings is like tuning an instrument — every strategy has its own rhythm and tempo. Some require fast reactions to catch short-term moves, while others need stronger filtering to focus on the bigger picture. If the settings don’t match the strategy, the signals can become noisy, delayed, or misleading, making it harder to stay in sync with the market.
Scalping
For scalping, traders often use an RSI Period of 7-9 because it reacts quickly to short-term price movements. It works like a fast radar screen, helping traders catch rapid market swings, though the faster signals also come with more market noise and false setups.
Day Trading
For day trading, the most common RSI setting is 9-14. It provides a balanced view of intraday momentum, filtering out some market noise while still reacting quickly enough to capture short-term trading opportunities. For many traders, this is the go-to RSI setup.
Swing Trading
For swing strategies, traders typically use an RSI Period of 14-21 or higher. This setting offers a broader view of market momentum, producing smoother signals and helping filter out short-term market noise and false moves.
These are widely considered the best RSI settings, depending on your trading pace.
How to Use RSI in Forex Trading
Overbought and Oversold Levels
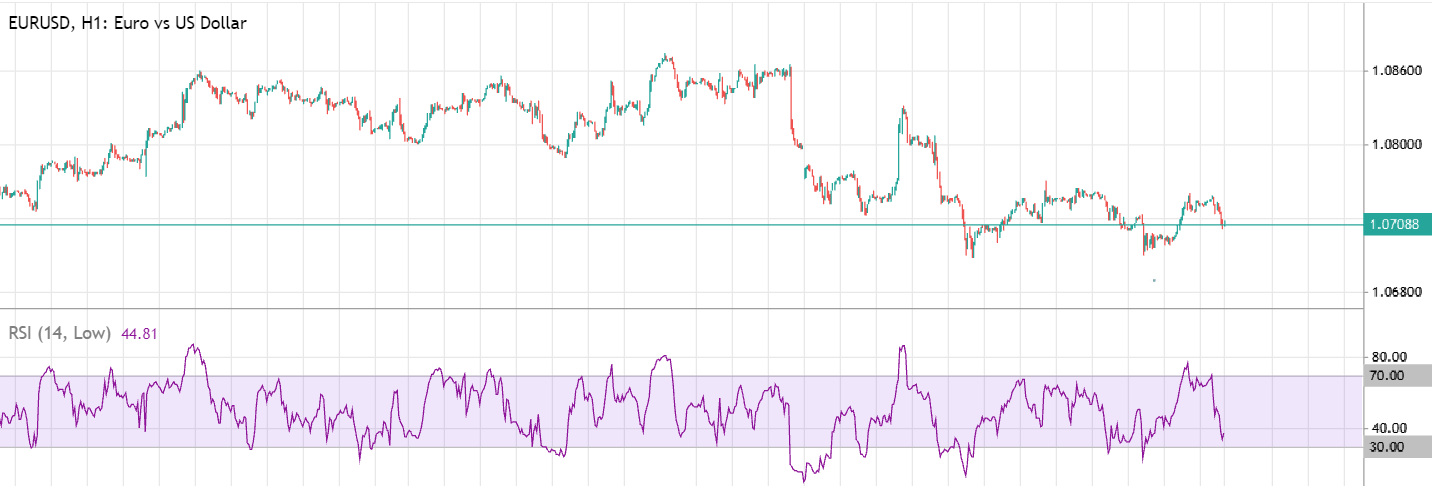
Many traders compare the RSI to a rubber band. When the indicator climbs too far above 70, the market may be overstretched and vulnerable to a pullback. When RSI drops below 30, selling pressure may be exhausted, increasing the chances of a rebound. This idea forms the foundation of many RSI trading strategies.
RSI Divergence

RSI divergence is when price and momentum start telling different stories. For example, price can make a new high while RSI fails to confirm it, which signals that upside momentum is fading. On the other hand, price may drop to a new low while RSI holds up, suggesting selling pressure is losing strength. In trading, this is often seen as an early warning that a reversal may be coming.
Trend Confirmation
RSI can also act like a “truth detector” for trends.
- In strong uptrends, RSI tends to float above the midline like a rising tide.
- In downtrends, it stays below, like pressure pushing everything lower.
This RSI confirmation helps traders avoid fighting the trend.
Best RSI Trading Strategies
A good RSI Forex strategy is like combining tools in a toolbox rather than relying on just one hammer. Popular methods include:
- Buying oversold dips in range markets
- Following trend momentum in strong markets
- Using divergence as an early warning signal
The key is not prediction, but reaction to momentum shifts.

RSI with Other Indicators
RSI works best when it’s not alone, like a musician in a band, not a solo act.
- Moving Averages. They act like the “direction of the current,” helping confirm RSI signals.
- Bollinger Bands. Work like elastic boundaries, showing when the price is stretched too far.
- Support and Resistance. These are like invisible floors and ceilings where RSI signals become stronger.
Together, they improve the reliability of any RSI Forex trading setup.
Common RSI Mistakes Traders Make
- Treating RSI as a crystal ball instead of a guide
- Ignoring the overall trend
- Taking every signal without confirmation
- Overtrading, like every RSI move, is meaningful

Real RSI Trade Example
A simple RSI trading strategy in action:
- Price falls into a strong support zone
- RSI drops below 30, signaling exhaustion
- RSI divergence appears (momentum weakens while price stabilizes)
- Buyers slowly step in
- RSI climbs back above 30
It’s like watching storm clouds clear before the sun fully returns.
Conclusion
The RSI indicator is one of the most trusted tools in Forex trading because it simplifies something complex — market momentum. Whether used for finding divergence, overbought/oversold zones, or confirmation, it helps traders read the market’s rhythm. But like any tool, it works best when paired with context, patience, and solid risk management, because in trading, timing matters more than prediction.