
The hammer candlestick pattern is one of the most recognizable signals in trading. Think of it as the market “hitting the brakes” after a sharp drop. Sellers push the price down hard, but buyers step in and slam it right back up.
For beginners learning how markets behave, the hammer trading strategy is often the first real step into price action trading.
Article content
What Is a Hammer Candlestick Pattern?
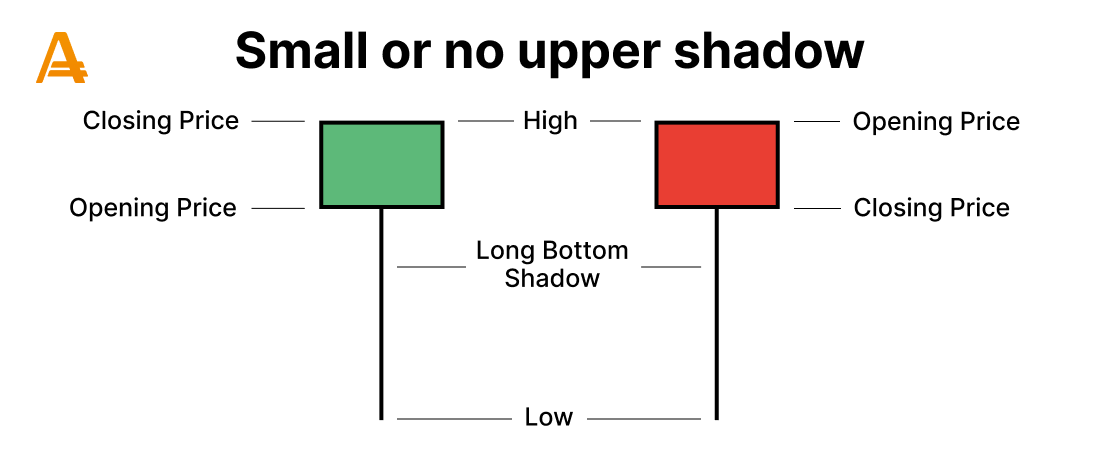
A bullish hammer pattern is a single candle that forms after a downtrend. It has:
- A small real body near the top
- A long lower shadow (wick)
- Little to no upper wick
In simple terms, it shows rejection of lower prices. Sellers tried to push the market down, but buyers took control before the candle closed. This is why traders often see it as a potential “turning point” candle. It is not a guarantee, but rather a warning light flashing on the dashboard.
Psychology Behind the Hammer Pattern
The story behind the hammer is more important than the shape. At first, bears are in control. Price drops sharply, and it looks like the downtrend will continue. But then something changes. Buyers step in aggressively and push prices back up near the opening level. It’s like a tug-of-war where one side suddenly runs out of strength. That shift in momentum is what gives the hammer candlestick pattern its reputation as a powerful reversal signal.

How to Identify a Valid Hammer
Not every candle with a long wick is a true signal. To avoid fakeouts, focus on structure.
Body Size
The real body should be small and located near the top of the candle range. A large body weakens the pattern.
Lower Wick Length
The lower wick should be at least 2-3 times the body’s size. This shows strong rejection of lower prices.
Volume Confirmation
Higher volume strengthens the signal. If the hammer forms on increased volume, it suggests real participation, not just noise.
This is where many traders go wrong. They see a shape but ignore context.
How to Trade the Hammer Pattern
Understanding how to trade hammer candle setups is all about timing and patience. There are three main components.
Entry Strategies
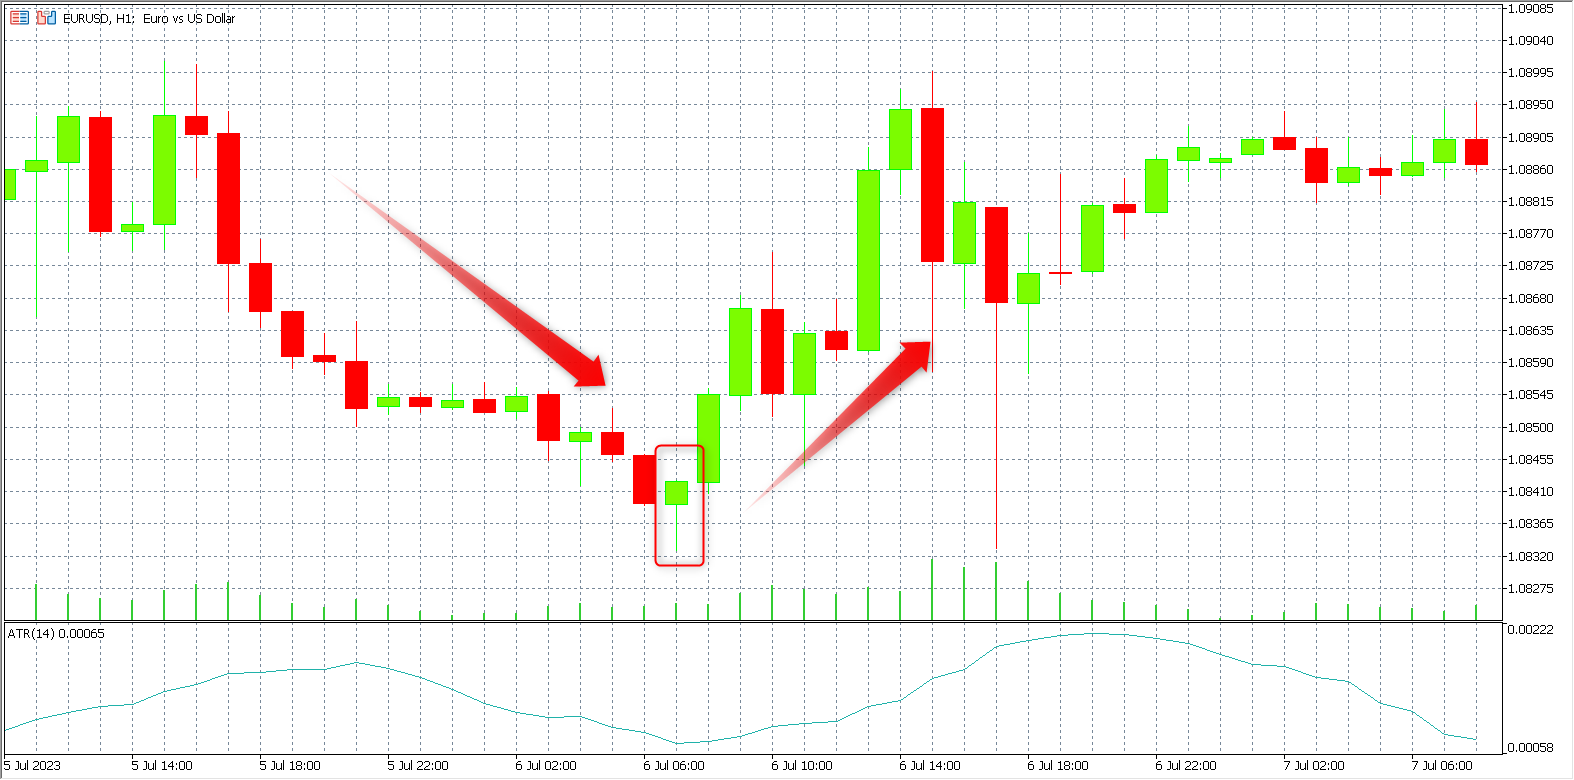
There are two common approaches:
- Aggressive entry. Buy as soon as the hammer closes.
- Conservative entry. Wait for the next candle to break above the hammer high.
The second approach is often preferred because it uses a hammer candle confirmation, filtering out weak setups. Think of it like waiting for the green light instead of jumping the yellow.
Stop-Loss Placement
Risk management is where traders survive or fail. A common method is placing the stop-loss just below the hammer’s wick. If the price breaks that level, the setup is invalidated. Another approach is using fixed risk percentages per trade, depending on your account size.
Take-Profit Targets
Profit targets should be realistic:
- Previous resistance levels
- Swing highs
- Risk-to-reward ratios like 1:2 or 1:3
Don’t try to catch the entire move, take what the market gives you.

Hammer vs Inverted Hammer vs Hanging Man
Understanding the difference between hammer and hanging man and similar candles helps avoid confusion.
- Hammer. Bullish reversal after a downtrend.
- Hanging Man. Same shape, but appears after an uptrend (bearish warning).
- Inverted hammer pattern. A small body with a long upper wick can signal a bullish reversal if confirmed.
Same “shape family,” but different meanings depending on context, like words that change meaning depending on tone.
Common False Signals and Mistakes
The hammer pattern reliability depends heavily on context. Common mistakes include:
- Trading hammers in sideways markets
- Ignoring trend direction
- Entering without confirmation
- Using it alone without support/resistance
A hammer without context is just a candle, not a strategy.

Best Indicators to Combine with Hammer Patterns
To improve accuracy, combine the hammer pattern with:
- Support and resistance zones
- RSI (to spot oversold conditions)
- Moving averages (trend direction)
- Volume analysis
When multiple signals align, the setup becomes much stronger, like multiple witnesses telling the same story.
Real Trading Example
Imagine the price has been falling for several days. It reaches a strong support level and prints a hammer with high volume. The next candle breaks above the hammer high, that’s your confirmation. A trader enters the trade, places a stop-loss below the wick, and targets the next resistance zone. This is the bullish hammer setup: simple, clean, and structured.
Conclusion
The pattern is powerful, but only when used with discipline and context. It’s not a magic signal. It’s more like a clue in a larger investigation. If you treat it as part of a system instead of a standalone answer, the strategy can become a solid foundation in your trading toolbox. The market doesn’t hand out certainties, only probabilities. The hammer just helps you read those probabilities a little more clearly.