


March 19, 2024
To install the Sentiment Indicator in your MT4 platform, follow these simple steps:
- Download the Sentiment Indicator file Sentiment-Indicator.ex4
- Launch the AMarkets – MetaTrader 4 terminal.
- Open the “File” menu, then select “Open Data Folder”.
- Navigate to the “MQL4\Indicators” subfolder and paste the “Sentiment-Indicator.ex4” file there.
- Restart the AMarkets – MetaTrader 4 terminal.
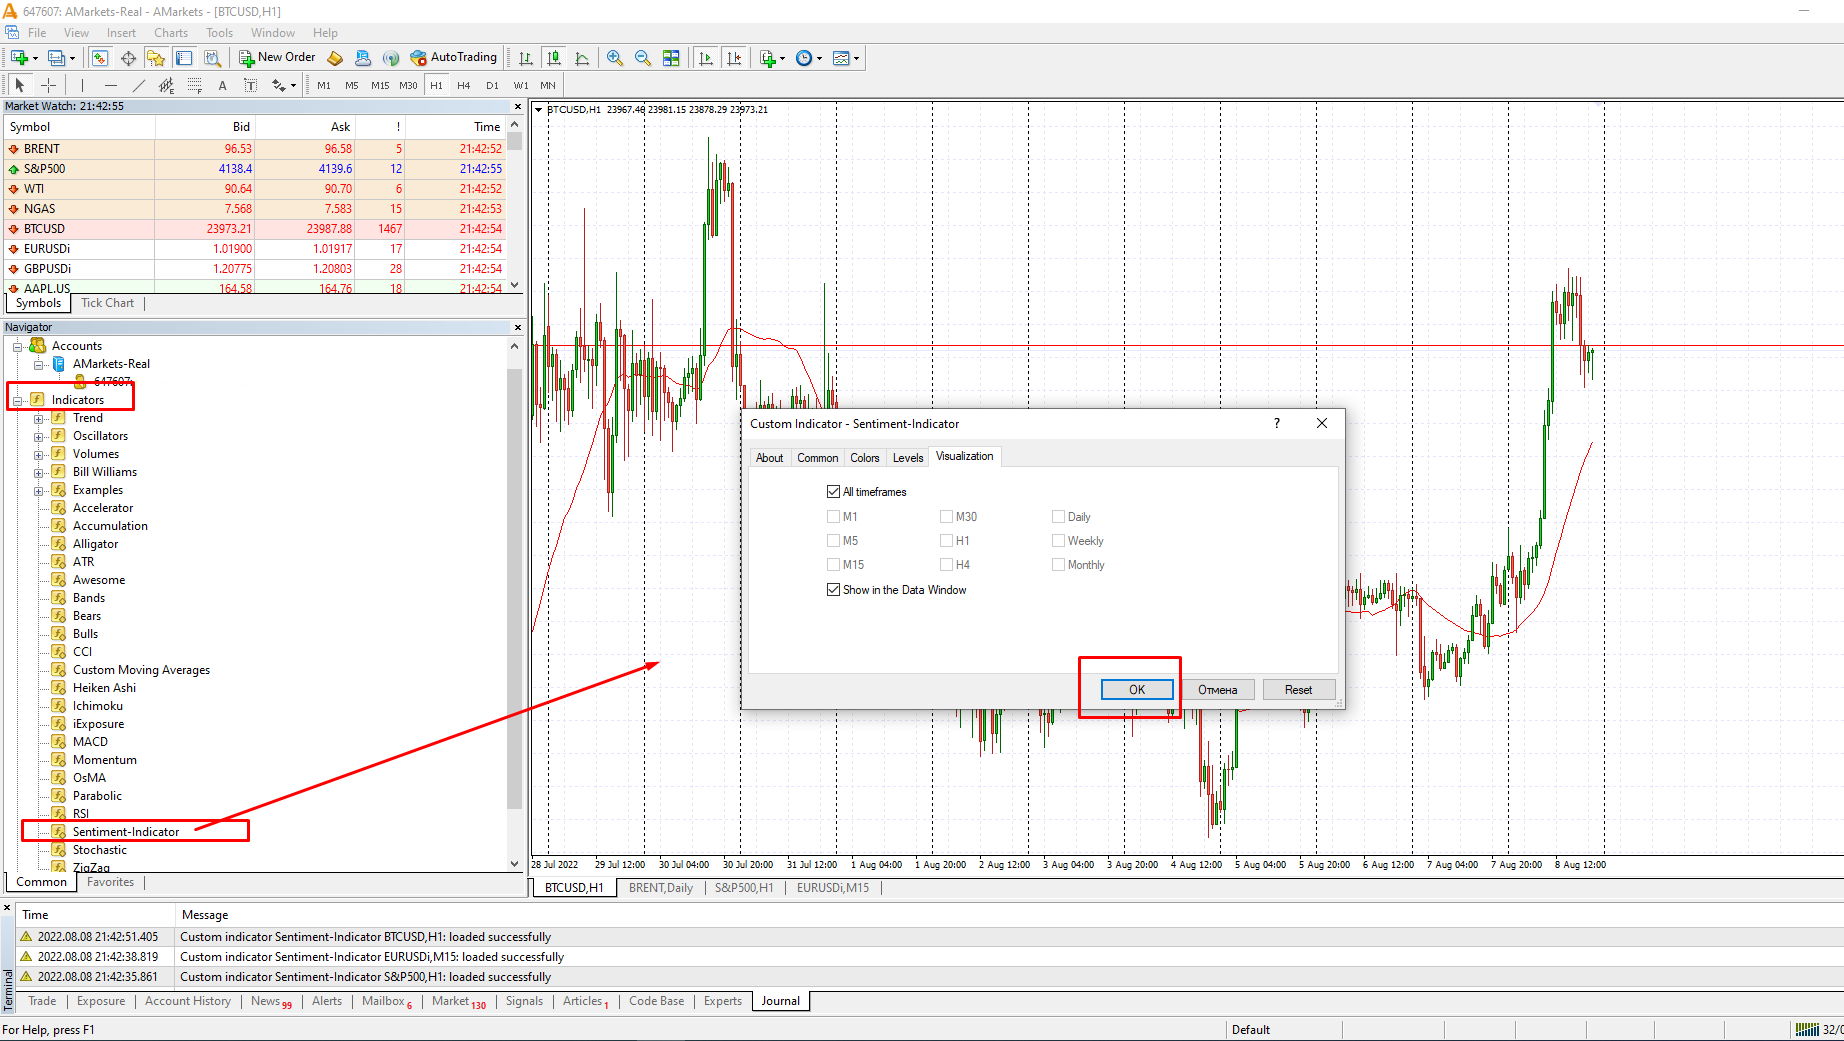
- Open the “View”menu and select “Navigator”. In the “Navigator” window, expand the list of “Indicators” by clicking on the “+” sign.
- Drag and drop the Sentiment-Indicator onto the сhart of a desired financial instrument and timeframe.
The Sentiment Indicator is currently available for 25 trading instruments:
|
|
|
Once installed, a Sentiment Indicator window will appear at the bottom of the MetaTrader 4 terminal window, below the chart. If the Sentiment Indicator window does not appear, try adding the indicator again. If the Sentiment Indicator window appears but its contents are empty, check the Experts tab (located at the bottom of the MetaTrader 4 terminal window). This tab may provide information about the error. For example:
- For CADCHF, the Sentiment Indicator (CADCHF.SI) is not found. This error indicates that either the Sentiment Indicator is not available for this instrument, or the history of the indicator is missing on this type of MetaTrader 4 server (for example, on a demo server).
- Sentiment Indicator instrument receiving error (USDJPY.SI): 4107. This is a software issue. For a list of current software errors in the MetaTrader 4 trading platform, please follow this link.
- Sentiment Indicator’s history cannot be read. Try to open EURUSD.SI. In this case, open the specified chart window, remove the Sentiment Indicator, and then re-add it to the chart.
How to Use the Sentiment Indicator
The Sentiment Indicator displays the percentage of traders buying and selling a currency, providing insight into whether bulls or bears dominate the market.
This indicator ranges from 0 to 100, indicating buying or selling activity. An increase in purchase volumes suggests a bullish market sentiment, meaning most market participants are currently buying the currency. And vice versa – rising selling volumes indicate a bearish sentiment, with most traders selling the instrument. It’s important to note that extreme values of 0 and 100 are rarely reached.
The Sentiment Indicator has critical values known as extremums – these levels are 30 and 70. When the percentage of orders opened in one direction reaches these critical values, it can serve as a powerful signal, indicating not only a potential trend slowdown and an upcoming correction but also the possibility of a trend reversal.
Levels 30 and 70 indicate an overbought or oversold market. When the Sentiment Indicator falls into the zone from 0 to 30, it suggests that the trading instrument has entered the oversold zone, indicating a potential upward reversal. Conversely, if the Sentiment Indicator is in the range of 70 to 100, it signals that the trading instrument is in the overbought zone, hinting at a potential downward movement.
It’s crucial to understand that extreme values vary among trading instruments. For instance, a currency pair may historically reverse at 65% of long positions, while another might only reverse at 90%. Monitoring these levels helps anticipate potential reversals accurately.